
17 B2B Marketing KPIs That Actually Drive Revenue (2026 Benchmarks)

· 31 min read

In B2B marketing, the pressure to prove value and contribute directly to the bottom line is immense. While vanity metrics like social media likes or impressions might feel good, they don't resonate in the boardroom. VPs of Sales and CMOs want to see tangible results: pipeline growth, revenue generation, and operational efficiency. The key to demonstrating this impact lies in tracking the right performance indicators. Focusing on the correct marketing KPIs for B2B is what separates high-growth, data-driven teams from those just spinning their wheels on low-impact activities.

This comprehensive guide moves beyond simple definitions. We will break down the eight most critical KPIs that every B2B marketing and sales leader should have on their dashboard. For each metric, we'll provide actionable comparisons, realistic benchmarks to aim for, and practical strategies you can implement immediately to improve your numbers. You won't find generic advice here; instead, you'll get a clear framework for measuring what truly matters.

Whether your goal is to justify a budget increase, optimize your demand generation engine, or align more closely with sales, this listicle provides the data-backed insights you need. By the end, you will understand not only what to measure but also how to use these KPIs to make smarter strategic decisions, prove marketing’s contribution to revenue, and build a more predictable growth model. Let's dive into the metrics that genuinely move the needle.

1. Marketing Qualified Leads (MQLs)

A Marketing Qualified Lead (MQL) is more than just a contact; it's a prospect who has actively shown interest in your brand and fits your ideal customer profile. These individuals have engaged with your marketing materials, such as downloading a whitepaper or attending a webinar, signaling they are ready to learn more but are not yet prepared for a direct sales conversation. Tracking MQLs is one of the most fundamental marketing kpis b2b because it directly measures the effectiveness of your top-of-funnel activities in generating high-potential prospects.

Marketing Qualified Leads (MQLs)

This KPI bridges the gap between marketing efforts and sales readiness. By defining what constitutes an MQL, you create a clear handoff point, ensuring the sales team receives leads who have already been warmed up and vetted. This alignment, pioneered by platforms like HubSpot and formalized by frameworks like the SiriusDecisions Demand Waterfall, is critical for efficient B2B growth.

How to Implement and Track MQLs

Implementing an MQL system involves a combination of demographic, firmographic, and behavioral data. A simple lead scoring model is the best place to start. Assign points for attributes that match your ideal customer (e.g., industry, company size, job title) and actions that indicate interest (e.g., pricing page visits, demo requests).

  • Define Your Criteria: Work directly with the sales team to create a universally agreed-upon definition of an MQL. Actionable Step: Hold a joint workshop and document the final definition in a shared Service Level Agreement (SLA).
  • Set a Threshold: Determine a point score at which a lead officially becomes an MQL and is passed to the sales team. For instance, a lead might need to accumulate 100 points to qualify. Actionable Step: Start with a conservative threshold and adjust it based on the MQL-to-SQL conversion rate feedback from sales.
  • Automate the Process: Use your CRM or marketing automation platform to track lead scores automatically. Set up workflows to notify sales representatives as soon as a lead hits the MQL threshold.

Key Insight: A common mistake is setting MQL criteria and never revisiting them. Your ideal customer profile and their buying signals will evolve. Review and adjust your lead scoring rules at least quarterly based on which MQLs successfully convert into sales opportunities.

Actionable Tips for MQL Optimization

To maximize the value of your MQLs, focus on continuous refinement and quality control. For example, Salesforce improved MQL accuracy by 40% using predictive lead scoring, which analyzes historical data to identify the attributes of high-converting leads.

  • Implement Negative Scoring: Penalize actions that signal a poor fit, such as a student email address or visits to your "Careers" page. Actionable Step: Create a list of disqualifying criteria with your sales team and assign a negative score (e.g., -50 points) to each in your marketing automation platform.
  • Use Lead Decay: Automatically reduce a lead's score if they go inactive for a specific period (e.g., 30 or 60 days) to keep your pipeline fresh. Actionable Step: Set up an automation rule to subtract 10 points for every 30 days of inactivity.
  • Track MQL-to-SQL Conversion: This is the ultimate test of MQL quality. If this rate is low (e.g., below 10%), it’s a clear sign your MQL criteria are too broad and need to be tightened. If it's very high (e.g., above 50%), your criteria might be too strict, and you could be missing opportunities.

By focusing on the quality and not just the quantity of MQLs, you provide the sales team with a stronger pipeline, reduce wasted effort, and accelerate the sales cycle. To explore this topic further, you can get more details about lead generation KPIs on Marketbetter.ai.

2. Customer Acquisition Cost (CAC)

Customer Acquisition Cost (CAC) measures the total expense incurred to acquire a new customer, including all marketing and sales costs. This metric encompasses everything from ad spend and content creation to salaries and software subscriptions. Tracking CAC is fundamental among marketing kpis b2b because it directly assesses the financial efficiency of your entire go-to-market engine, ensuring your growth is not just rapid but also profitable.

A healthy CAC is the bedrock of a scalable B2B business model. By calculating this figure, you gain a clear understanding of the resources required to win a customer, which allows for smarter budget allocation and strategic planning. The concept was heavily popularized by venture capitalists like David Skok and thought leaders like Jason Lemkin (SaaStr), who emphasized the importance of unit economics in building sustainable SaaS companies.

How to Implement and Track CAC

To implement CAC tracking, you must meticulously account for all expenses related to sales and marketing over a specific period and divide that total by the number of new customers acquired in the same timeframe. This includes salaries, commissions, software tools, ad spend, and overhead.

  • Define Your Formula: The basic formula is (Total Sales & Marketing Expenses) / (Number of New Customers Acquired). Ensure your finance, sales, and marketing teams agree on which costs are included for consistency.
  • Segment Your Data: Don't stop at a single, blended CAC. Actionable Step: Calculate CAC for each marketing channel (e.g., Paid Search CAC vs. Content Marketing CAC). This comparison will reveal your most profitable acquisition pathways.
  • Establish a Tracking Cadence: Monitor CAC on a monthly and quarterly basis. Given the long sales cycles in B2B, quarterly trends often provide more meaningful insights than short-term fluctuations. To further refine your understanding and tracking of this vital metric, you can master the cost of customer acquisition calculation.

Key Insight: A common mistake is ignoring the B2B sales cycle lag. A marketing expense in Q1 might not result in a new customer until Q3. When evaluating CAC, factor in your average sales cycle length to more accurately attribute costs to the customers they helped acquire.

Actionable Tips for CAC Optimization

Reducing CAC is about improving efficiency, not just cutting costs. For example, Dropbox famously lowered its CAC from over $300 to under $40 by implementing a viral referral program that turned its user base into a powerful acquisition channel.

  • Focus on High-LTV Segments: Identify the customer segments with the highest Lifetime Value (LTV) and double down on the channels that most effectively reach them. Actionable Step: Use an LTV:CAC ratio of at least 3:1 as your benchmark for a healthy acquisition model. If a channel's ratio is 1:1, it's losing money.
  • Optimize Your Funnel: Improve conversion rates at each stage of the buyer's journey. Actionable Step: A 5% increase in your MQL-to-SQL conversion rate means your marketing spend is working more efficiently, which directly lowers CAC without cutting the budget.
  • Invest in Retention: It's almost always cheaper to retain an existing customer than acquire a new one. Strong customer retention increases LTV, which in turn justifies a higher CAC for strategic growth initiatives.

By diligently tracking and optimizing CAC, you ensure that every dollar spent on growth generates a sustainable return. For a deeper dive, explore how to use a Customer Acquisition Cost calculator to model different scenarios.

3. Pipeline Velocity

Pipeline Velocity is a compound metric that measures the speed at which qualified leads travel through your sales pipeline to become revenue. It calculates this by multiplying the number of opportunities by your average deal value and win rate, then dividing the total by the length of your sales cycle. This is one of the most powerful marketing kpis b2b because it offers a holistic view of sales efficiency, moving beyond static metrics to show the true momentum of your revenue engine.

Pipeline Velocity

Unlike KPIs that focus on a single variable like lead volume or deal size, Pipeline Velocity synthesizes four critical factors into one actionable number. A high velocity is better than a low velocity, indicating a healthier and more efficient revenue engine. This allows you to forecast revenue more accurately and pinpoint specific bottlenecks in your process. The concept, popularized by Ken Krogue of InsideSales.com, provides a dynamic health score for your entire sales and marketing operation.

How to Implement and Track Pipeline Velocity

To track Pipeline Velocity, you first need to reliably measure its four components: number of opportunities, average deal value, win rate, and sales cycle length. The core formula is: (# Opportunities × Average Deal Value × Win Rate) / Sales Cycle Length (in days).

  • Gather Your Data: Pull these four metrics from your CRM for a specific period (e.g., the last quarter). Ensure your data is clean and your deal stages are clearly defined.
  • Calculate Your Baseline: Run the formula to establish your current Pipeline Velocity. This number represents the amount of revenue your pipeline is generating per day.
  • Monitor and Segment: Track this KPI weekly or monthly to spot trends. Actionable Step: Compare the velocity of inbound-sourced deals vs. outbound-sourced deals. You may find inbound deals have a shorter sales cycle and higher win rate, resulting in much higher velocity.

Key Insight: A common mistake is focusing on improving just one component, like increasing the number of opportunities. True acceleration comes from making incremental improvements across all four variables simultaneously. Even a small lift in win rate and a slight reduction in sales cycle length can have an exponential impact on your velocity.

Actionable Tips for Pipeline Velocity Optimization

Improving velocity requires a coordinated effort between marketing and sales to influence each variable. For instance, Salesforce increased its pipeline velocity by 50% by reducing its average sales cycle from 6 to 4 months through better lead qualification and process refinement.

  • Reduce Sales Cycle Length: Implement a stricter lead qualification framework (like BANT or MEDDIC) to ensure sales only works on high-intent leads. Actionable Step: Create a one-page sales enablement guide that answers the top 5 customer questions at the consideration stage to remove friction.
  • Increase Win Rates: Develop competitive intelligence battle cards and provide ongoing product training. Actionable Step: Use tools like Gong.io to analyze sales calls from won vs. lost deals and replicate the behaviors of top-performing reps.
  • Grow Average Deal Value: Train your sales team on value-based selling, upselling, and cross-selling techniques. Actionable Step: Create bundled packages or tiered pricing that encourages larger initial purchases and present them on your pricing page.
  • Generate More Qualified Opportunities: Focus marketing efforts on channels and campaigns that historically produce high-converting leads. Refine your MQL criteria to ensure a better handoff to the sales team.

4. Marketing Sourced Revenue

Marketing Sourced Revenue is the ultimate measure of accountability, tracking the total revenue generated from deals where marketing created the initial opportunity. Unlike marketing-influenced revenue, which includes any deal marketing touched, this KPI isolates the opportunities that originated directly from marketing activities like campaigns, content, or inbound channels. Tracking Marketing Sourced Revenue is one of the most powerful marketing kpis b2b because it proves marketing's direct contribution to the bottom line and justifies budget allocation to executive leadership.

This KPI moves the conversation from leads and clicks to dollars and cents, aligning marketing directly with the company's primary financial goals. It answers the crucial question: "How much new business did marketing bring in?" This focus on origination, heavily promoted by frameworks from SiriusDecisions and thought leaders like Craig Rosenberg, empowers marketers to demonstrate their role not just as a support function but as a primary revenue engine.

How to Implement and Track Marketing Sourced Revenue

Accurately tracking sourced revenue requires a clear attribution model and a tightly integrated CRM and marketing automation platform. A first-touch attribution model is the most straightforward way to assign "source" credit, attributing the opportunity to the very first interaction a prospect had with your brand.

  • Define "Marketing Sourced": Create a formal Service Level Agreement (SLA) with sales that clearly defines what constitutes a marketing-sourced lead and opportunity. For example, any inbound lead from a demo request form that becomes an opportunity is "marketing sourced."
  • Automate Source Tracking: Use your CRM (like Salesforce) and marketing platform (like HubSpot) to automatically tag leads with their original source (e.g., "Organic Search," "Paid Social," "Webinar"). This field should be locked once set.
  • Build Custom Reports: Create a dashboard in your CRM that filters for all closed-won opportunities where the "Original Source" field contains a marketing channel. Sum the value of these deals to calculate your total Marketing Sourced Revenue.

Key Insight: A common mistake is to only track sourced revenue. While critical, it doesn't tell the whole story. Report on both Marketing Sourced and Marketing Influenced revenue to provide a complete picture of marketing’s impact. For example, Marketing Sourced might be 30% of revenue, while Marketing Influenced could be 70%, showing broad impact across the entire customer journey.

Actionable Tips for Sourced Revenue Optimization

To maximize marketing’s sourced revenue, you need to prove which channels are most effective at generating new business. For example, account-based marketing firm Terminus demonstrated that its ABM programs generated twice as much marketing-sourced revenue as traditional demand generation tactics, proving the value of a targeted approach.

  • Exclude Non-Marketing Sources: Ensure your reporting explicitly excludes deals sourced by sales (e.g., outbound prospecting, referrals) or partners to maintain the integrity of your KPI.
  • Set Realistic Targets: For many B2B companies, achieving 30-40% of total revenue from marketing-sourced opportunities is a strong benchmark. This figure can vary based on your sales model and industry. A sales-led organization might be lower, while a product-led growth company might be much higher.
  • Analyze Channel Performance: Actionable Step: Create a quarterly report comparing the Marketing Sourced Revenue from each channel (e.g., SEO, PPC, Webinars). If you find that SEO sources 50% of your marketing revenue but only receives 20% of the budget, it’s a clear signal to reallocate funds.

By meticulously tracking and analyzing Marketing Sourced Revenue, you shift the perception of marketing from a cost center to a predictable revenue driver, earning a strategic seat at the executive table. For a deeper dive into attribution models, check out the resources from pioneers like Full Circle Insights.

5. Website Conversion Rate

The Website Conversion Rate measures the percentage of visitors who complete a desired action on your site, such as filling out a form, downloading a resource, or requesting a demo. In the B2B world, where sales cycles are long and decisions are complex, this KPI is a direct indicator of how effectively your website transforms anonymous traffic into identifiable leads. It’s one of the most critical marketing kpis b2b because it assesses the performance of your most valuable digital asset.

Website Conversion Rate

This metric connects your content and user experience directly to lead generation. While B2B conversion rates are typically lower than B2C counterparts (often 1-3% for B2B vs. 3-5%+ for B2C), each conversion holds significantly higher value. Optimizing this rate, a practice championed by platforms like Unbounce and Optimizely, means you are not just getting more traffic but getting more value from the traffic you already have.

How to Implement and Track Website Conversion Rate

To track this KPI, you must define what a "conversion" means for your business and set up goal tracking in your analytics platform, like Google Analytics. The calculation is straightforward: (Number of Conversions / Total Visitors) × 100.

  • Define Conversion Goals: Identify key actions that signal prospect interest. This could be a "Contact Us" form submission, a whitepaper download, or a free trial signup. Create distinct goals for each.
  • Set Up Tracking: Use a tool like Google Tag Manager to implement conversion tracking pixels or event tracking for specific button clicks and form submissions on your website.
  • Segment Your Data: Actionable Step: In Google Analytics, compare the conversion rate of Organic traffic vs. Paid traffic. This helps you understand which audience is more engaged and allows you to tailor landing pages for each source.

Key Insight: A common mistake is sending all campaign traffic to the homepage. Dedicated landing pages with a single, clear call-to-action consistently outperform homepages. For example, Crazy Egg increased its conversion rate by a staggering 363% simply by simplifying its landing page to focus on one primary CTA.

Actionable Tips for Conversion Rate Optimization

Continuous testing and refinement are key to improving your conversion rate. Small changes can lead to significant gains in lead generation without increasing your marketing spend. For instance, Databox boosted trial signups by 127% by adding social proof and removing unnecessary form fields.

  • Reduce Form Friction: Each additional form field can decrease conversions. Actionable Step: Run an A/B test on your demo request form. Test a version with 3 fields (Name, Email, Company) against your current version with 6 fields and measure the lift in submissions.
  • Leverage Social Proof: Add testimonials, client logos, case studies, and trust badges near your CTAs to build credibility and reduce hesitation.
  • Optimize High-Traffic Pages First: Prioritize your optimization efforts on pages that already receive the most visitors to see the biggest impact quickly.
  • Test Your CTAs: A/B test your call-to-action copy, color, and placement. Actionable Step: Test a benefit-oriented CTA like "Get Your Free Audit" against a generic one like "Submit" to see which drives more clicks.

By methodically optimizing your website's conversion points, you directly enhance the efficiency of your entire marketing funnel, ensuring your traffic generation efforts translate into tangible business leads.

6. Marketing Return on Investment (ROI)

Marketing Return on Investment (ROI) is the ultimate measure of accountability, calculating the revenue generated from marketing activities compared to the cost of those activities. This fundamental KPI answers the critical question: "For every dollar spent on marketing, how much revenue did we generate?" In B2B, where sales cycles are long and deal values are high, proving ROI is essential for justifying budgets and securing executive buy-in. It is one of the most vital marketing kpis b2b because it translates marketing efforts directly into financial impact.

This KPI moves beyond vanity metrics like clicks and impressions to provide a clear, bottom-line assessment of marketing's contribution to the business. By accurately calculating ROI, marketing teams can demonstrate their value, make smarter investment decisions, and align their goals with the company's overall financial health. This concept has been championed by organizations like Forrester Research, which developed frameworks to help B2B marketers prove their worth.

How to Implement and Track ROI

Implementing a system to track marketing ROI requires disciplined financial tracking and a robust attribution model. The basic formula is: [(Revenue Attributed to Marketing - Marketing Cost) / Marketing Cost] × 100. The challenge lies in accurately attributing revenue and accounting for all costs.

  • Define Your Costs: Catalog all marketing expenses, including ad spend, technology subscriptions, content creation, agency fees, and even a portion of team salaries.
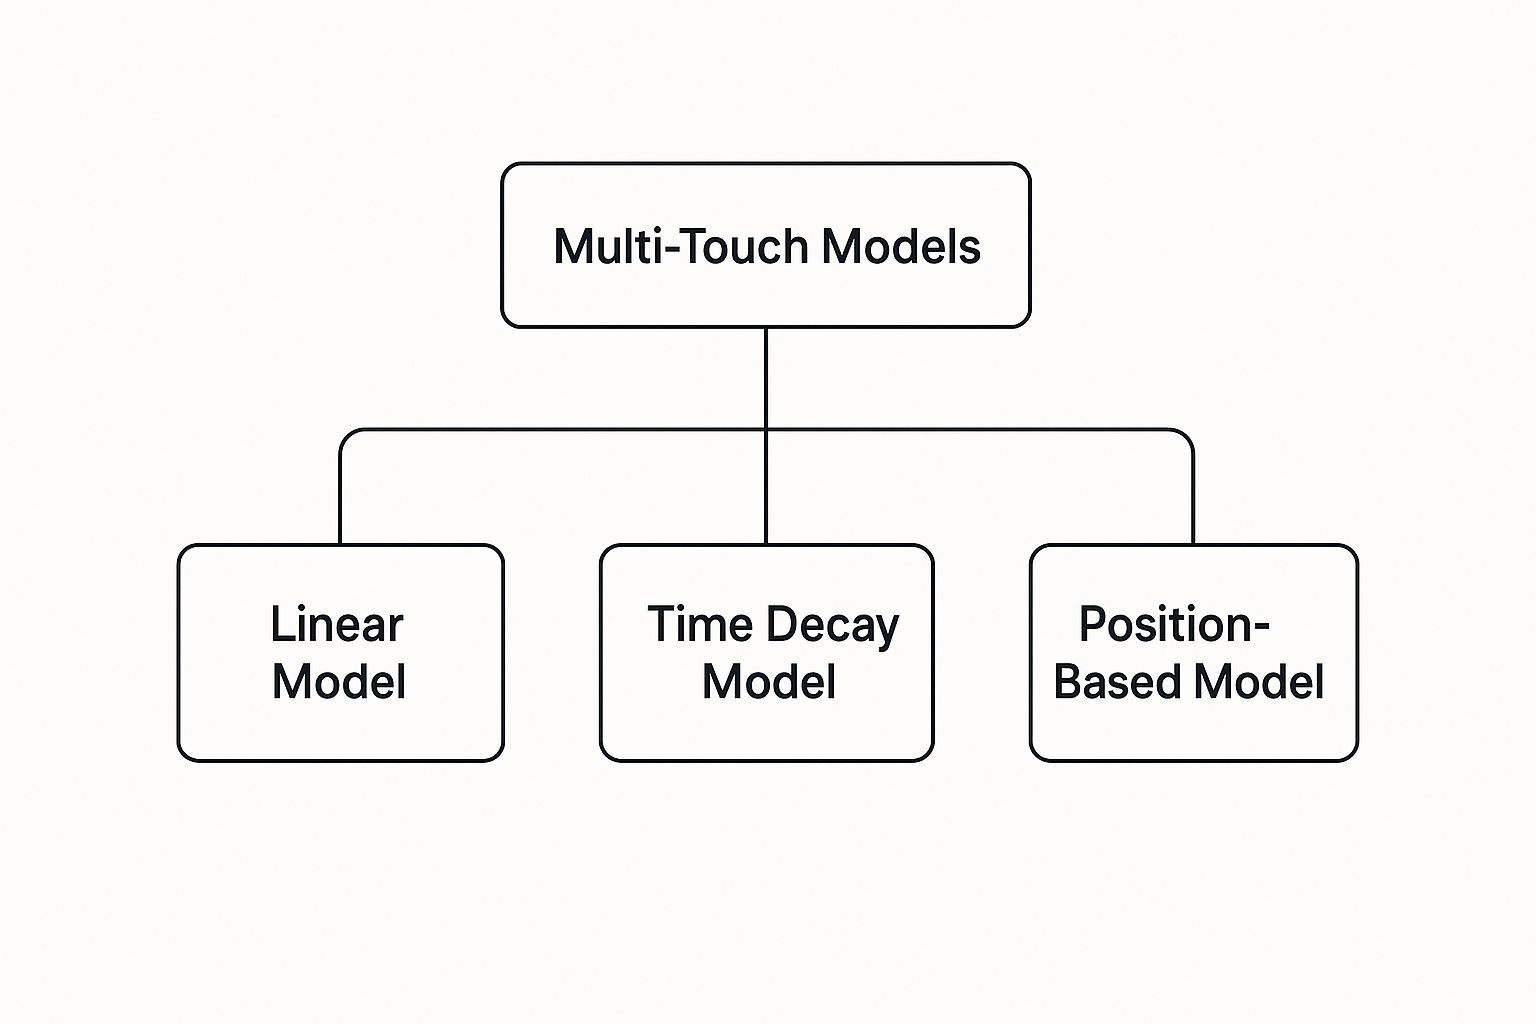
  • Establish Attribution Rules: Work with sales and finance to agree on a multi-touch attribution model (e.g., linear, U-shaped, W-shaped) that fairly distributes revenue credit across various marketing touchpoints.
  • Use Your Tech Stack: Leverage your CRM and marketing automation platform to connect campaign costs to the leads, opportunities, and closed-won deals they influence.

Key Insight: A common pitfall is ignoring the B2B sales cycle length. Calculating ROI too soon can make effective, long-term strategies look like failures. Implement time-lagged analysis, measuring ROI over 6, 12, or even 18 months to give deals enough time to close and accurately reflect marketing's impact. For example, content marketing ROI may take 12+ months to materialize, while a PPC campaign's ROI can be measured in weeks.

Actionable Tips for ROI Optimization

To maximize your marketing ROI, you must be strategic about where you allocate your budget and ruthless about cutting what doesn't work. For example, Snowflake demonstrated an impressive 8:1 ROI on its account-based marketing program by focusing its budget on high-value enterprise accounts rather than broad, less-efficient campaigns.

  • Calculate ROI by Channel: Don't just measure overall ROI. Actionable Step: Break it down by channel (e.g., content marketing, paid search, events) to identify your most profitable activities. If paid search has a 2:1 ROI and content marketing has a 7:1 ROI, you know where to reallocate your budget.
  • Aim for a 5:1 Ratio: While benchmarks vary, a common B2B target is a 5:1 ROI, meaning $5 in revenue for every $1 spent. Anything less may warrant re-evaluation, while a ratio of 10:1 or higher indicates a highly effective program.
  • Track Both Campaign and Program ROI: Measure the short-term ROI of individual campaigns (e.g., a webinar series) and the long-term ROI of overarching programs (e.g., your entire content marketing strategy). This comparison prevents you from cutting long-term, high-value programs in favor of short-term wins.

By focusing on a clear and consistent ROI calculation, you can shift the conversation from marketing as a cost center to marketing as a revenue engine. For a deeper dive into measuring the effectiveness of your marketing spend, consider reading this guide on understanding marketing return on investment. To further refine your approach, you can learn more about how to measure marketing effectiveness on Marketbetter.ai.

7. Sales Cycle Length

Sales Cycle Length measures the average time from the first contact with a prospect to closing a deal. This KPI is especially critical in B2B marketing because extended sales cycles directly impact cash flow, revenue predictability, and resource planning. Tracking this metric helps marketing teams identify bottlenecks, create more effective nurturing programs, and better align content with the buyer's journey. A shorter cycle is often a strong indicator of an efficient sales process and effective marketing enablement.

This KPI provides a direct feedback loop on the efficiency of your entire go-to-market motion. By analyzing how long deals take to close, you can diagnose issues in lead quality, sales processes, or product-market fit. Methodologies like MEDDIC and thought leaders such as Jacco van der Kooij have popularized the focus on sales velocity, where shortening the sales cycle is a key component for accelerating revenue growth.

How to Implement and Track Sales Cycle Length

Tracking sales cycle length requires consistent data entry within your CRM. The most common calculation is the sum of the days for all won deals (from first contact to close date) divided by the total number of won deals. This gives you a clear baseline to work from.

  • Establish Clear Stage Definitions: Ensure your CRM has clearly defined deal stages, and sales reps consistently update them. This allows you to measure the time spent in each stage.
  • Segment Your Data: Do not rely on a single, blended average. Actionable Step: Compare the sales cycle length for leads from different sources. You may find that webinar-sourced leads close 30% faster than trade show leads, indicating a higher level of initial education and intent.
  • Automate Reporting: Use your CRM's reporting and dashboard features to track sales cycle length automatically. Set up alerts for deals that stagnate in a particular stage for too long.

Key Insight: A common mistake is only tracking the cycle length for won deals. Analyzing the cycle length of lost deals is equally important. If you're losing deals after a long and resource-intensive cycle (e.g., 90+ days), it often points to a fundamental flaw in your qualification process early in the funnel. Losing deals quickly is far more efficient.

Actionable Tips for Sales Cycle Optimization

To actively shorten your sales cycle, you must diagnose and address the specific stages where deals stall. For example, Outreach.io reduced its own sales cycle by 33% by using its platform to automate follow-ups and better qualify leads, preventing stalled conversations.

  • Strengthen Lead Qualification: Improve MQL criteria to ensure sales starts with higher-intent prospects. Use qualification frameworks like BANT or MEDDIC to disqualify poor-fit opportunities earlier.
  • Create Sales Enablement Content: Actionable Step: If you see deals stalling in the proposal stage, create a "Why Us vs. Competitor X" one-sheet and an ROI calculator to help your champions sell internally. This directly addresses friction points.
  • Map the Buying Process: Create content that helps your champions build an internal business case, navigate procurement, and get stakeholder buy-in, as this is often where B2B deals slow down.
  • Identify Pipeline Bottlenecks: Analyze which stage takes the longest. If deals stall at the proposal stage, perhaps your pricing is too complex. If they stall after the demo, your value proposition may not be clear enough.

8. Marketing Qualified Lead to Sales Qualified Lead Conversion Rate (MQL-to-SQL)

The MQL-to-SQL Conversion Rate measures the percentage of marketing-generated leads that the sales team accepts and qualifies for their pipeline. This metric is a direct reflection of the alignment between marketing and sales, serving as a crucial quality check at the most important handoff point in the funnel. Tracking this as one of your core marketing kpis b2b reveals whether marketing is not just generating leads, but generating the right leads.

This KPI is foundational to efficient revenue operations because a low conversion rate signals a disconnect. It means marketing's definition of a "good lead" doesn't match what sales considers a viable opportunity. A healthy MQL-to-SQL rate (e.g., 15-30%) indicates strong alignment, whereas a low rate (e.g., less than 10%) suggests marketing efforts are being wasted on leads sales won't pursue. This concept was central to the SiriusDecisions Demand Waterfall, which standardized the definitions of funnel stages like MQL and SQL to create a more predictable revenue engine.

How to Implement and Track MQL-to-SQL Conversion Rate

Calculating this rate is straightforward: (Total Sales Qualified Leads / Total Marketing Qualified Leads) × 100. The real work lies in establishing the processes that make this metric meaningful. It requires tight collaboration and clear, documented definitions.

  • Establish a Service Level Agreement (SLA): Formally document the specific criteria for both an MQL and an SQL. This agreement should also define the expected follow-up time from sales and the process for accepting or rejecting leads.
  • Automate Lead Status Updates: Use your CRM to create distinct lifecycle stages. When a sales rep accepts an MQL, they should change its status to "SQL," allowing you to track the conversion automatically.
  • Systemize Rejection Reasons: Actionable Step: Implement a mandatory dropdown field in your CRM for sales to select a reason when rejecting an MQL (e.g., "Not in buying cycle," "Wrong contact," "Budget not a fit"). This provides actionable data for marketing.

Key Insight: Don't view a low MQL-to-SQL rate as a marketing failure. Instead, treat it as a diagnostic tool. Consistent feedback from sales, especially through structured rejection reasons, is the most valuable data you have for refining lead scoring models and campaign targeting.

Actionable Tips for MQL-to-SQL Optimization

To improve your conversion rate, focus on feedback loops and data-driven refinement. For instance, 6sense boosted its MQL-to-SQL conversion from 18% to 35% by using AI-powered intent data to prioritize accounts actively researching solutions, ensuring sales focused on the hottest prospects.

  • Hold Weekly MQL Reviews: Actionable Step: Dedicate 30 minutes each week for marketing and sales leads to review a sample of recently accepted and rejected MQLs. Discuss why some worked and others didn't to create an immediate feedback loop.
  • Segment by Source: Analyze your MQL-to-SQL rate by channel, campaign, and content asset. Actionable Step: Compare the conversion rate from webinar leads (40%) vs. tradeshow leads (15%). This insight tells you to invest more in webinars or better pre-qualify leads at events.
  • Implement a Lead Recycling Program: For MQLs rejected for timing reasons ("Not ready yet"), place them into a long-term nurture sequence. Don't let these potential future opportunities go cold.

Key Metrics Comparison of Top 8 B2B Marketing KPIs

KPI / MetricImplementation Complexity 🔄Resource Requirements ⚡Expected Outcomes 📊Ideal Use Cases 💡Key Advantages ⭐
Marketing Qualified Leads (MQLs)Medium - Requires lead scoring and CRM integration with ongoing refinementModerate - Marketing automation tools and data analytics neededBetter lead prioritization and sales efficiency; clearer marketing-to-sales handoffLead nurturing and qualification in B2B demand generationImproves sales efficiency, prioritizes high-conversion leads
Customer Acquisition Cost (CAC)High - Complex cost tracking and accurate attribution neededHigh - Requires detailed financial and sales data integrationInsight into marketing and sales efficiency; budgeting and financial planningBudget allocation, investor reporting, strategy optimizationClear visibility into acquisition costs and channels
Pipeline VelocityHigh - Composite metric needing multiple data points and accurate calculationHigh - Sales data, CRM, and analytics platforms requiredPredictive revenue generation, identifies bottlenecks, accelerates salesRevenue forecasting and sales process optimizationHolistic sales performance insight and revenue acceleration
Marketing Sourced RevenueMedium - Needs reliable attribution and CRM data linkageModerate - Attribution systems and data integrationDemonstrates direct marketing contribution to revenue and ROI justificationMarketing budget justification and campaign evaluationClear accountability of marketing impact on revenue
Website Conversion RateLow to Medium - Basic tracking via analytics platformsLow - Standard web analytics tools typically sufficientMeasures website effectiveness in lead generation and user experienceWebsite and landing page optimizationQuick feedback on website effectiveness and easy to measure
Marketing Qualified Lead to Sales Qualified Lead Conversion Rate (MQL-to-SQL)Medium - Needs CRM tracking and agreed definitionsModerate - CRM and lead management toolsReveals lead quality alignment between marketing and salesMarketing-sales handoff quality measurement and SLA enforcementStrengthens marketing-sales alignment and lead quality accountability
Marketing Return on Investment (ROI)High - Requires accurate revenue attribution and cost trackingHigh - Integration of financial data with marketing performanceQuantifies marketing effectiveness and informs budget decisionsExecutive reporting, budget planning, campaign performanceUniversal metric understood by finance and leadership
Sales Cycle LengthMedium - Tracking deal stages and time intervals in CRMModerate - Sales CRM and reporting toolsImproves forecasting, cash flow, and identifies process bottlenecksSales efficiency measurement and pipeline managementHelps optimize sales process and resource allocation
Free Tool

Try our Marketing Plan Generator — generate a complete AI-powered marketing plan in minutes. No signup required.

From Data to Decisions: Activating Your B2B Marketing KPIs

Navigating the complex B2B landscape without the right key performance indicators is like sailing a ship without a compass. You might be moving, but you have no real way of knowing if you are heading toward your destination. Throughout this article, we've explored eight foundational marketing KPIs B2B teams must master, from top-of-funnel indicators like Marketing Qualified Leads (MQLs) to bottom-line metrics such as Marketing Sourced Revenue and ROI.

Merely tracking these numbers in a spreadsheet, however, is not the endgame. The true power lies in transforming this raw data into strategic action. These KPIs are not isolated figures; they are interconnected pieces of a much larger puzzle that, when assembled correctly, reveal a clear picture of your marketing engine's health and performance. The goal is to move beyond passive reporting and into a mode of active, data-informed decision-making.

Connecting the Dots: From Isolated Metrics to a Cohesive Strategy

The real magic happens when you start analyzing these KPIs in relation to one another. This comparative analysis is what separates high-performing marketing teams from the rest. It allows you to diagnose issues with precision and identify opportunities for optimization that would otherwise remain hidden.

Consider these diagnostic scenarios:

  • Scenario 1: High MQLs, Low MQL-to-SQL Conversion Rate: Your top-of-funnel content and lead generation efforts are working brilliantly, attracting a large volume of leads. However, a significant drop-off when passing them to sales signals a critical misalignment. Actionable Step: Schedule an immediate workshop with sales leadership to review the MQL definition and scoring criteria. Use the "rejected MQL" data from your CRM to pinpoint the exact reasons for the low acceptance rate and adjust your targeting or scoring accordingly.

  • Scenario 2: High Customer Acquisition Cost (CAC), Low Marketing ROI: If you're spending heavily to acquire each new customer but seeing a poor return, it's a clear sign of channel inefficiency. Actionable Step: Conduct a channel-by-channel audit. Compare the CAC and ROI for each major channel (e.g., paid search, LinkedIn ads, content marketing). Pause spending on the lowest-performing channel for one month and reallocate that budget to the highest-performing channel to see if overall ROI improves.

  • Scenario 3: Long Sales Cycle Length, Low Pipeline Velocity: When deals are taking too long to close and moving slowly through the pipeline, it's a major red flag for revenue predictability. This indicates friction in the buyer's journey. Actionable Step: Analyze your CRM data to identify which deal stage is the longest. If deals consistently stall after the demo, create a specific piece of sales enablement content, like a targeted case study or an ROI calculator, to help prospects build an internal business case and move to the next stage.

Key Insight: Individual KPIs tell you what is happening. Connected KPIs tell you why it's happening. The "why" is where strategic advantage is born.

Building a Predictable Revenue Engine

Ultimately, the consistent monitoring and activation of these marketing KPIs for B2B is about building a predictable revenue engine. When you understand your conversion rates at each stage, your sales cycle length, and the true cost of customer acquisition, you can forecast future revenue with greater accuracy. This predictability is invaluable, not just for the marketing department, but for the entire organization, enabling smarter budgeting, hiring, and strategic planning.

By moving from a reactive "what were last month's numbers?" approach to a proactive "how can this data improve next month's strategy?" mindset, you elevate marketing from a cost center to a proven driver of business growth. You can confidently walk into any executive meeting armed with data that tells a compelling story of marketing’s direct contribution to the bottom line, justifying budget requests and securing your team's seat at the strategic table. This is the ultimate value of mastering your B2B marketing KPIs: turning data into dialogue, dialogue into decisions, and decisions into demonstrable revenue.


Ready to move from complex spreadsheets to clear, actionable insights? marketbetter.ai unifies all your B2B marketing KPIs into a single, intuitive dashboard, using AI to surface the critical connections between your metrics. Stop guessing and start making data-driven decisions that prove your marketing's value by visiting marketbetter.ai to see how you can build a more predictable revenue engine today.

10 Social Media Engagement Strategies That Actually Work in 2026 (With Real Examples)

· 29 min read

In a saturated digital marketplace, a high follower count offers little more than vanity. True influence isn't measured in passive likes; it's built through active, meaningful interactions. Comments, shares, direct messages, and saves are the currency of modern social media, signaling to algorithms that your content is valuable and worth amplifying. Moving beyond superficial metrics is no longer optional; it is the core of a successful digital presence. Without genuine engagement, even the largest audience is just shouting into a void, yielding minimal impact on brand loyalty or revenue.

This article cuts through the noise of generic advice. We will provide a comprehensive breakdown of 10 proven social media engagement strategies designed to transform passive followers into a vibrant community of brand advocates. Each strategy is presented with actionable implementation steps, real-world examples, and a clear comparison of its strengths and best-use cases. You will learn how to launch compelling User-Generated Content (UGC) campaigns, leverage interactive polls for instant feedback, and build authority through value-first educational content.

We'll explore everything from influencer collaborations and live streaming to the nuanced art of social listening and community building. These tactics are foundational for any business, regardless of size. For a comprehensive understanding of leveraging social media for your business, consult this actionable guide to social media marketing. Whether you're a B2B marketing professional aiming to generate qualified leads or a B2C brand focused on cultivating customer loyalty, the following strategies will provide a clear roadmap to achieving tangible business results through powerful online engagement.

1. User-Generated Content (UGC) Campaigns

User-Generated Content (UGC) campaigns are among the most powerful social media engagement strategies because they shift the focus from the brand to the customer. Instead of creating all your own content, you encourage your audience to create and share content featuring your products, services, or brand experience. This approach transforms passive followers into active brand advocates, leveraging their authentic voices to build trust and community far more effectively than traditional advertising.

User-Generated Content (UGC) Campaigns

Unlike brand-created content, which is often polished and can feel distant, UGC is raw, relatable, and serves as powerful social proof. When potential customers see real people enjoying your products, it resonates more deeply than a carefully crafted ad. A UGC campaign is a more scalable approach compared to influencer marketing, as it sources content from hundreds of fans rather than a handful of paid creators. Think of Apple's iconic #ShotOniPhone campaign, which turns everyday customers into celebrated photographers, or GoPro’s adventure-fueled feeds, which are almost entirely composed of thrilling customer-shot videos.

How to Implement a UGC Campaign

Successfully launching a UGC initiative requires a clear framework that makes it easy for your audience to participate. The goal is to inspire creation, not to demand it. Here’s how to take action.

  • Actionable Step 1: Create a Unique Hashtag. Develop a simple, memorable, and unique branded hashtag for your campaign. This acts as a digital filing system, making it easy to track submissions and for others to discover the content. Coca-Cola's #ShareACoke is a classic example of a hashtag that became a cultural phenomenon.
  • Actionable Step 2: Set Clear Guidelines & Offer Incentives. Clearly communicate what you're looking for. Are you running a photo contest? A video challenge? Outline the rules and offer a compelling reason to participate, such as a chance to be featured on your page, win a prize, or receive a discount. An incentive is crucial to overcome initial inertia.
  • Actionable Step 3: Always Ask for Permission. Before reposting anyone's content, you must get their explicit permission. A simple direct message asking if you can feature their photo or video (and credit them) is professional and legally sound.
  • Actionable Step 4: Engage and Amplify. Publicly thank and engage with every user who contributes. Featuring their content on your feed is the ultimate reward and encourages others to join in.

By building a system that celebrates your customers, you create a sustainable engine for authentic content. To explore this topic further, you can dive deeper into implementing effective user-generated content strategies to empower your audience as brand advocates.

2. Interactive Content & Polls

Interactive content is one of the most direct social media engagement strategies because it actively invites users to participate rather than just passively consume. This approach includes polls, quizzes, Q&As, and surveys that require a click, a tap, or a typed response. It transforms the one-way communication of a standard post into a two-way dialogue, instantly boosting interaction rates and signaling to social media algorithms that your content is valuable and engaging.

Interactive Content & Polls

Unlike static posts that followers can easily scroll past, interactive elements create a "micro-commitment" that holds attention. When a user votes in a poll or answers a question, they become more invested in your brand and the outcome. This strategy offers a lower barrier to entry compared to UGC, as it requires only a click from the user, not content creation. Think of Spotify's wildly successful annual "Wrapped" campaign, which provides users with personalized, shareable data quizzes, or Netflix using Instagram Story polls to let audiences vote on potential plot points for interactive shows.

How to Implement Interactive Content

Deploying interactive content effectively requires a blend of creativity and strategic planning. The goal is to make participation feel effortless and rewarding for your audience. Here are actionable steps.

  • Actionable Step 1: Leverage Platform-Specific Features. Use built-in tools like Instagram and Facebook Story polls, quizzes, and question stickers for quick, 24-hour engagement spikes. On Twitter, polls are a simple yet powerful way to gather opinions.
  • Actionable Step 2: Ask Simple, Compelling Questions. Frame questions that are easy to answer but still provide value. Dunkin' effectively uses Twitter polls to let customers vote on new donut flavors, making followers feel like part of the decision-making process.
  • Actionable Step 3: Share the Results. Always follow up by sharing the results of your polls or quizzes. This closes the feedback loop, validates user participation, and makes them more likely to engage with future interactive content. Failing to do this can make the interaction feel pointless.
  • Actionable Step 4: Mix Entertainment with Market Research. Use fun quizzes, like Buzzfeed's famous personality tests, to drive shares and brand awareness. Simultaneously, use practical surveys to gather crucial insights about customer preferences that can inform your product development or content strategy.

By turning your social media feed into an interactive space, you not only increase engagement metrics but also gather valuable, zero-party data directly from your most dedicated followers.

3. Influencer Partnerships & Collaborations

Influencer partnerships are one of the most effective social media engagement strategies for reaching new, highly targeted audiences through a trusted source. This approach involves collaborating with individuals who have established credibility and a dedicated following in a specific niche. By leveraging the authentic connection an influencer has with their community, brands can introduce their products or services in a way that feels like a genuine recommendation rather than a disruptive advertisement.

This strategy's power lies in borrowed trust. When an influencer that followers know and respect endorses a brand, that credibility is transferred, making the audience more receptive to the message. Compared to traditional ads, which audiences are often trained to ignore, an influencer's post feels native to the platform and more trustworthy. The collaborations between Gymshark and fitness influencers, or Dunkin's partnership with TikTok star Charli D'Amelio, which boosted app downloads by 57%, showcase how these alliances can generate massive engagement and tangible business results.

When selecting partners, it's crucial to look beyond follower counts and analyze engagement rates, as this data reveals the true influence and connection an individual has with their audience. The following infographic provides a quick reference for typical engagement rates across different influencer tiers.

Infographic showing key data about Influencer Partnerships & Collaborations

The data clearly shows that smaller, more niche influencers often deliver a higher engagement rate, providing a better return on investment and a more authentic connection for brands. This makes partnering with several micro-influencers a potentially more effective and affordable strategy than hiring one mega-influencer.

How to Implement Influencer Partnerships

A successful influencer collaboration is built on mutual respect, clear communication, and shared goals. It's about building a genuine relationship, not just a transactional exchange. Follow these steps to get started.

  • Actionable Step 1: Prioritize Alignment Over Reach. Choose influencers whose values, audience demographics, and content style align perfectly with your brand. A small, engaged, and relevant audience is far more valuable than a large, mismatched one. Use tools like SparkToro or Upfluence to find influencers based on audience data, not just vanity metrics.
  • Actionable Step 2: Start with Micro-Influencers. For brands new to this strategy, micro-influencers (10K-100K followers) often provide the best balance of reach, engagement, and affordability. Their recommendations are often perceived as more authentic and trustworthy.
  • Actionable Step 3: Grant Creative Freedom. Provide clear campaign guidelines and objectives, but allow the influencer creative control to present your product in their unique voice. This ensures the content feels natural to their audience and not like a forced script.
  • Actionable Step 4: Track and Measure ROI. Use unique discount codes, affiliate links, or dedicated landing pages to track the performance of each collaboration. This data is essential for measuring effectiveness and optimizing future campaigns.

By treating influencers as true partners, you can build long-term relationships that drive consistent and authentic brand advocacy. To integrate these partnerships into a broader growth plan, explore how they fit within a comprehensive demand generation strategy to attract and convert new customers.

4. Story-Driven Content & Behind-the-Scenes

Story-driven content and behind-the-scenes glimpses are powerful social media engagement strategies that pull back the curtain on your brand. Instead of only showcasing polished final products, this approach shares the authentic narrative of your company: its people, processes, values, and even its challenges. It humanizes your brand, transforming it from a faceless entity into a relatable group of individuals working toward a common goal, fostering a much deeper emotional connection with your audience.

Story-Driven Content & Behind-the-Scenes

Unlike polished ad campaigns that often feel distant and create a barrier, behind-the-scenes content builds trust through transparency. When followers see the genuine effort, creativity, and passion that goes into your work, they feel more invested in your success. Brands like Patagonia excel at this by sharing their environmental activism and supply chain journey, while Buffer gained a loyal following through its radical transparency, openly sharing revenue metrics and employee salaries. This unfiltered view makes a brand feel more authentic and trustworthy compared to competitors who only show a perfect facade.

How to Implement Story-Driven Content

Effectively sharing your brand's story requires a commitment to authenticity and consistency. The goal is to invite your audience into your world, making them feel like insiders. Here’s how to make it happen.

  • Actionable Step 1: Utilize Ephemeral Content. Use Instagram and Facebook Stories for raw, unedited daily snapshots. Document a day in the life of an employee, show the product development process, or share candid moments from a team meeting. The temporary nature encourages immediate viewing.
  • Actionable Step 2: Humanize Your Brand. Regularly feature your team members. Employee takeovers, interviews, or simple spotlights help put a face to your brand, making it far more relatable than a logo.
  • Actionable Step 3: Show the Full Picture. Don't just share your victories. Documenting challenges and even failures makes your journey more compelling and your brand more authentic. This transparency builds a strong, trust-based relationship with your audience.
  • Actionable Step 4: Create Recurring Content Series. Develop a consistent series, like "Maker Monday" or "Team Tuesday," to give your audience something to look forward to. This creates a predictable rhythm and keeps them coming back for more.

By integrating storytelling and transparency into your social media engagement strategies, you build a community, not just a customer base. This approach creates a narrative that people can connect with and support, turning followers into loyal advocates who are invested in your brand's journey.

5. Social Listening & Real-Time Engagement

Social listening and real-time engagement represent one of the most proactive social media engagement strategies available. It moves beyond simply posting content and waiting for reactions; instead, it involves actively monitoring digital conversations for mentions of your brand, competitors, and industry keywords. This is a reactive strategy, compared to the proactive nature of a content calendar, allowing you to turn passive mentions into meaningful interactions.

This strategy is about being present and agile. It transforms your social media channels from a broadcast monologue into a dynamic dialogue with your community. Think of Oreo's legendary "You can still dunk in the dark" tweet during the 2013 Super Bowl blackout or Wendy's viral roasts that originated from monitoring brand mentions. These moments weren't planned in a content calendar; they were born from listening to the digital landscape and seizing an opportunity to connect in a relevant, timely manner.

How to Implement Social Listening

Effective real-time engagement requires a structured approach to monitoring and a clear plan for responding. The key is to be prepared to act quickly without sacrificing brand voice or quality. Here's your action plan.

  • Actionable Step 1: Establish a Monitoring Framework. Use tools like Sprout Social or Brandwatch to track not just your brand name but also common misspellings, product names, executive names, and key industry hashtags. Monitoring competitors also provides invaluable insight into their customer sentiment and uncovers opportunities you can leverage.
  • Actionable Step 2: Develop a Response Matrix. Not every mention requires the same response. Create guidelines that empower your team to act decisively. For example, a customer complaint might trigger a move to DMs, a positive mention could earn a public thank you and a reshare, while a neutral question receives a quick, helpful answer.
  • Actionable Step 3: Set Response Time Goals. In today's fast-paced digital world, speed matters. Aim to respond to urgent issues, like customer service complaints, in under an hour. For general mentions, a goal of a few hours is reasonable. This demonstrates that you are attentive and value your audience's input.
  • Actionable Step 4: Empower Your Team. Real-time opportunities disappear fast. Waiting for multiple layers of approval will cause you to miss the moment. Empower your social media team with the autonomy to engage within the established brand guidelines, trusting them to make smart, timely decisions.

By actively listening and participating in conversations as they happen, you show your audience that you are more than just a brand; you are a responsive and engaged member of their community. This builds immense trust and fosters a loyal following.

6. Video Content & Live Streaming

Video content and live streaming are cornerstones of modern social media engagement strategies, capitalizing on platform algorithms that heavily favor dynamic media. This approach involves a multimedia mix of short-form vertical videos (Reels, TikToks), long-form content, and interactive live broadcasts. Video is uniquely effective at capturing attention, conveying emotion and personality, and simplifying complex information far more efficiently than static images or text.

Unlike a simple photo post, video allows you to tell a story, demonstrate a product in action, and build a deeper human connection with your audience. While a polished, long-form video requires significant production resources, a live stream can be raw and immediate, offering a lower-effort way to leverage video. Think of Duolingo's viral TikToks featuring its mascot, which turned language learning into entertainment, or Sephora's makeup tutorials that provide genuine value and drive sales simultaneously. These brands prove that video isn't just content; it's a powerful tool for community building and brand storytelling.

How to Implement Video Content & Live Streaming

A successful video strategy requires consistency and an understanding of what resonates with your audience. The goal is to stop the scroll and provide content that either educates, entertains, or inspires.

  • Actionable Step 1: Prioritize Short-Form Vertical Video. Platforms like TikTok, Instagram Reels, and YouTube Shorts reward content in a 9:16 aspect ratio. Hook viewers within the first three seconds to prevent them from swiping away.
  • Actionable Step 2: Always Add Captions. A staggering 85% of social media video is watched without sound. Adding captions makes your content accessible and ensures your message lands, even in silent-play environments. Use tools like CapCut or Premiere Rush to add captions easily.
  • Actionable Step 3: Schedule Live Streams to Build Hype. Don't just go live spontaneously. Announce your live session in advance to build anticipation and maximize attendance. Use the session for Q&As, product launches, or behind-the-scenes tours.
  • Actionable Step 4: Engage and Repurpose. During live streams, actively respond to comments to foster a real-time conversation. Afterward, repurpose your long-form videos by clipping the best moments into multiple short-form posts to extend their reach and value.

By embracing a video-first mindset, you align your brand with current user behavior and algorithmic preferences. Creating this content is more accessible than ever with the right set of social media content creation tools designed to simplify your workflow.

7. Value-First Educational Content

The value-first educational content strategy prioritizes giving your audience genuinely useful information over making a direct sale. Instead of promotional posts, you share content that solves their problems, answers their questions, or teaches them a new skill. This approach fundamentally shifts your brand’s role from a seller to a trusted advisor, building deep, long-lasting relationships and establishing industry authority.

Unlike sales-focused content that often gets ignored, educational content attracts an audience actively seeking solutions. This is one of the most effective social media engagement strategies for fostering loyalty because it proves you care about your audience's success, not just their wallet. Compared to fleeting trends, educational content is often evergreen, providing value and driving traffic for months or even years. Think of HubSpot's extensive library of marketing blogs and guides, which has become an indispensable resource for professionals, or Home Depot's DIY video tutorials that empower homeowners to tackle projects themselves.

How to Implement a Value-First Educational Content Strategy

Creating valuable content requires understanding your audience's pain points and delivering solutions in an accessible format. The goal is to become their go-to resource. Here’s an actionable plan.

  • Actionable Step 1: Answer Common Questions. Create content that directly addresses your most frequently asked customer questions. This not only provides immediate value but also reduces the burden on your support team. A simple "How to..." guide can generate significant engagement.
  • Actionable Step 2: Use the 80/20 Rule. Dedicate 80% of your content to providing pure educational value and only 20% to promotional material. This balance ensures your audience stays engaged without feeling constantly sold to.
  • Actionable Step 3: Develop Content Pillars. Identify core areas of your expertise and build a content strategy around them. For example, a financial advisor might focus on pillars like "Investing Basics," "Retirement Planning," and "Debt Management," creating consistent, authoritative content for each.
  • Actionable Step 4: Make Complex Topics Simple. Break down industry jargon and complicated subjects into easy-to-understand formats. Use Instagram carousels for step-by-step tutorials, LinkedIn articles for in-depth analysis, or short videos for quick tips.
  • Actionable Step 5: Repurpose and Amplify. Extend the life of your best educational content by repurposing it across different platforms. A detailed blog post can be transformed into a video tutorial, an infographic, a podcast episode, and a series of social media tips.

8. Community Building & Exclusive Groups

One of the most effective social media engagement strategies involves shifting from a public broadcast model to fostering a dedicated community. Creating exclusive groups on platforms like Facebook, LinkedIn, Discord, or dedicated forums allows you to nurture your most loyal followers in a private, intimate space. This approach transforms your brand from a content publisher into a community facilitator, building deep-rooted loyalty and a powerful sense of belonging that public feeds rarely achieve.

Unlike a public page where you speak at your audience, an exclusive group is a space where you can speak with them. This strategy is higher-effort but yields higher-quality engagement compared to broadcasting to a general audience. It's where your super-fans can connect, share experiences, and feel like true insiders. Think of Peloton's official member group, where users share milestones and encouragement, or Sephora's Beauty Insider Community, a hub for millions of makeup enthusiasts to swap tips and reviews. These spaces create an ecosystem where the brand is the common ground, but the members are the stars.

How to Implement a Community Building Strategy

Building a thriving community requires more than just creating a group; it demands active participation and a commitment to providing genuine value. The goal is to make members feel seen, heard, and rewarded for their loyalty.

  • Actionable Step 1: Establish Clear Guidelines & Purpose. Define the group's purpose and set clear rules for participation from day one. This ensures conversations stay on-topic, positive, and constructive. Your community guidelines should protect the space and make everyone feel welcome.
  • Actionable Step 2: Offer Exclusive Perks. Give members a compelling reason to join and stay. This could include early access to new products, exclusive discounts, behind-the-scenes content, or direct Q&A sessions with your team. Exclusivity is a powerful motivator.
  • Actionable Step 3: Facilitate, Don't Dominate. Your role is to spark conversations, not control them. Ask open-ended questions, create regular discussion prompts, and encourage member-to-member interactions. The community's real power comes from the connections members build with each other.
  • Actionable Step 4: Recognize and Empower Super-Fans. Identify your most active and helpful members. Publicly acknowledge their contributions, feature their content, or even invite them to become community moderators or brand ambassadors. This empowers advocates and encourages others to get more involved.

9. Strategic Timing & Consistency

One of the most impactful yet often overlooked social media engagement strategies is mastering the art of timing and consistency. This data-driven approach involves publishing content precisely when your audience is most active and maintaining a predictable posting schedule. This dual focus ensures maximum visibility for your posts and signals to platform algorithms that your account is a reliable source of fresh content, often rewarding it with better reach.

Simply creating great content isn't enough; it needs to be seen. Posting at 3 AM when your audience is asleep is a wasted effort, while posting during peak hours can dramatically increase likes, comments, and shares. This is a foundational strategy; without it, the impact of all other strategies is diminished. For example, B2B brands often find success on LinkedIn between 9 AM and 11 AM on weekdays, while a fashion brand on Instagram might see higher engagement from 7 PM to 9 PM when users are unwinding. The goal is to align your publishing schedule with your audience's daily digital habits.

How to Implement Strategic Timing & Consistency

A successful timing strategy is built on data, not guesswork. It requires a commitment to analyzing performance and establishing a sustainable workflow that prioritizes both quality and regularity.

  • Actionable Step 1: Analyze Your Platform Analytics. Dive into the native analytics on Instagram, Facebook, TikTok, and other platforms. Most have an "Audience" or "Insights" tab that shows the exact days and hours your followers are most active online. This is your starting point.
  • Actionable Step 2: Establish a Consistent Cadence. Determine a realistic posting frequency for each platform and stick to it. Whether it's daily on Twitter or three times a week on LinkedIn, consistency builds audience expectation and satisfies algorithms.
  • Actionable Step 3: Batch and Schedule Content. To avoid last-minute scrambling, dedicate time to create content in batches. Use scheduling tools like Buffer or Hootsuite to plan your posts in advance, ensuring your calendar is filled and your timing is precise.
  • Actionable Step 4: Test and Refine. Your initial data provides a baseline, but don't be afraid to experiment. Test posting 30 minutes before or after a peak time and track the performance. Continuously refine your schedule based on what the engagement data tells you.

By synchronizing your content delivery with audience behavior, you ensure your message lands with maximum impact. You can learn more about how to pinpoint these optimal times by exploring guides on the best times to post on social media to fine-tune your schedule.

10. Personalization & Audience Segmentation

Personalization and audience segmentation are advanced social media engagement strategies that move beyond a one-size-fits-all approach. Instead of broadcasting the same message to everyone, this method involves dividing your audience into smaller, specific groups based on demographics, behaviors, or interests. By tailoring content to these segments, you deliver a message that feels more relevant and personal, dramatically increasing its impact and fostering a stronger connection with your followers.

This targeted approach transforms your social media feed from a megaphone into a one-on-one conversation. When content directly addresses a follower's specific needs or passions, they are far more likely to engage. Compare this to a generic post that tries to appeal to everyone and ends up resonating with no one. Think of Spotify’s "Discover Weekly" playlists, which are so hyper-personalized they feel like a gift from a friend, or Netflix's customized artwork and recommendations that cater to individual viewing habits. These platforms prove that relevance is the key to retention and engagement.

How to Implement Personalization & Segmentation

Effective segmentation requires a data-informed approach to understand who your audience is and what they care about. The goal is to create content that resonates with distinct subgroups within your broader follower base.

  • Actionable Step 1: Identify and Define Your Segments. Use your social media analytics to identify natural audience clusters. Start with basic segmentation like location, age, or expressed interests. You can then create more detailed buyer personas for each major segment to guide your content creation.
  • Actionable Step 2: Create Tailored Content Streams. Develop content pillars that speak directly to the pain points and interests of each segment. For example, a fitness brand might create separate content for marathon runners versus yoga enthusiasts. Use platform features like Instagram's "Close Friends" list or targeted ads to deliver this content to the right people.
  • Actionable Step 3: Personalize at Scale. Use dynamic content in ads that changes based on the viewer’s data, such as showing different products to users in different cities. Address your audience directly in your copy, making them feel seen and understood. Always test your personalized content against more general posts to measure the lift in engagement.
  • Actionable Step 4: Respect Privacy. While using data to personalize, it is crucial to be transparent about how you use it and to respect user privacy. Building trust is paramount for this strategy to be effective long-term.

By speaking directly to the individuals within your audience, you make your brand more relatable and valuable. You can learn more about how to group your audience effectively by exploring different customer segmentation strategies to refine your approach.

Top 10 Social Media Engagement Strategies Comparison

StrategyImplementation Complexity 🔄Resource Requirements ⚡Expected Outcomes 📊Ideal Use Cases 💡Key Advantages ⭐
User-Generated Content (UGC) CampaignsMedium: Requires moderation, permissions managementLow to Medium: Mainly community managementIncreased trust, engagement, and reachBrands wanting authentic peer recommendations and fresh contentCost-effective, high trust, continuous fresh content
Interactive Content & PollsLow: Easy to create, requires consistent follow-upLow: Minimal content creation effortHigher engagement and valuable audience insightsQuick feedback, boosting engagement, market researchFast engagement, real-time insights, algorithm-friendly
Influencer Partnerships & CollaborationsHigh: Vetting, negotiation, ongoing managementHigh: Potentially expensive depending on influencer tierCredibility, targeted reach, authentic contentTargeted promotion via trusted voices, brand awarenessHigh ROI (especially micro-influencers), authentic endorsements
Story-Driven Content & Behind-the-ScenesMedium to High: Requires consistent content creationMedium: Content creation and employee participationDeep emotional connection, trust, differentiationHumanizing brands, building emotional resonanceBuilds strong emotional ties, transparency, high engagement
Social Listening & Real-Time EngagementHigh: Needs dedicated staff and clear protocolsMedium to High: Monitoring tools and staff timeCrisis management, customer relationships, trend participationBrands needing proactive customer service and reputation managementTimely responses, customer insights, crisis prevention
Video Content & Live StreamingHigh: Technical skills, equipment, production timeHigh: Production costs, editing, live supportHigher shares, retention, FOMO, emotional connectionsBrands leveraging visual storytelling and product demosSuperior engagement, multiple formats, algorithm prioritization
Value-First Educational ContentMedium to High: Requires expertise and timeMedium to High: Content development and researchAuthority building, SEO benefits, long-term trustBrands focusing on thought leadership and problem-solvingBuilds credibility, evergreen content, high saves/shares
Community Building & Exclusive GroupsHigh: Ongoing moderation and engagement requiredMedium to High: Moderation and management effortBrand loyalty, user advocacy, organic contentBrands wanting deeper interactions and advocacyStrong loyalty, user-generated content, lower acquisition cost
Strategic Timing & ConsistencyMedium: Requires analysis and scheduling toolsLow to Medium: Use of analytics and schedulingImproved reach, engagement, follower growthMaximizing impact via posting time optimizationMaximizes organic reach, audience routine building
Personalization & Audience SegmentationHigh: Data analysis, sophisticated content creationHigh: Tools and expertise for segmentationHigher engagement, conversion, customer lifetime valueBrands targeting multiple customer demographicsPrecise targeting, improved conversions, relevant messaging
Free Tool

Try our Marketing Plan Generator — generate a complete AI-powered marketing plan in minutes. No signup required.

Turning Strategy into Action: Your Next Steps for Higher Engagement

You now possess a robust playbook of ten powerful social media engagement strategies, moving beyond generic advice to actionable, results-driven tactics. We've navigated the creative power of User-Generated Content (UGC), the immediate feedback loop of Interactive Polls, the amplified reach of Influencer Partnerships, and the authentic connection built through Story-Driven Content. This is more than a list; it's a strategic framework for transforming your social media from a broadcast channel into a dynamic community hub.

The core lesson is this: engagement isn't a single action, but a comprehensive philosophy. It’s the difference between posting a video (a tactic) and launching a live stream Q&A session based on social listening (a strategy). It’s the contrast between simply sharing a customer photo and building a full-fledged UGC campaign with a unique hashtag and incentives. True engagement is proactive, responsive, and deeply rooted in providing value before asking for anything in return.

From Knowledge to Execution: A Phased Approach

The sheer number of options can feel overwhelming. The key is not to implement all ten strategies simultaneously. A scattered approach yields scattered results. Instead, a focused, phased implementation is your best path to measurable success. Think of it like a marketing sprint rather than a marathon with no finish line.

Your immediate next steps should be methodical:

  1. Establish Your Baseline: Before implementing any new strategy, conduct a thorough audit of your current social media performance. What is your average engagement rate? Which content formats perform best? Where are the most significant drop-offs? You cannot measure improvement without a clear starting point.

  2. Prioritize Based on Resources and Audience: Select two or three strategies from this list that align most naturally with your brand identity and available resources. A B2B tech company might prioritize Value-First Educational Content and Personalization, while a direct-to-consumer fashion brand might find more immediate success with UGC Campaigns and Influencer Collaborations.

  3. Commit to a Test Period: Dedicate one full business quarter to executing your chosen strategies. Consistency is critical. A single poll or one behind-the-scenes story won't move the needle. You need to commit to a sustained effort to gather meaningful data and give the strategy a fair chance to work.

Comparing Paths: UGC vs. Influencers, Community vs. Content

Consider the trade-offs. A UGC campaign is cost-effective and builds immense social proof, but it requires a pre-existing, motivated audience to contribute content. In contrast, influencer partnerships can deliver immediate, targeted reach to a new audience, but often require a significant budget and careful vetting to ensure brand alignment. Neither is inherently better; the "right" choice depends on whether your current goal is to activate your existing community or acquire a new one.

Similarly, compare Community Building in an exclusive group with creating broad-appeal Educational Content. A Facebook Group fosters deep loyalty and provides invaluable customer insights, but its impact is concentrated on a smaller, dedicated audience. A viral educational video or infographic, however, can generate massive top-of-funnel awareness but may not create the same level of brand advocacy. Your strategic choice here depends on whether you need to nurture leads or generate them.

Ultimately, mastering these social media engagement strategies is about transforming your brand from a passive announcer to an active participant in your audience's conversation. It's about building relationships, fostering trust, and creating a community that not only buys from you but advocates for you. The result isn't just higher engagement metrics; it's a stronger brand, a more loyal customer base, and a direct impact on your bottom line.


Ready to scale your engagement efforts with precision and intelligence? marketbetter.ai uses advanced AI to help you analyze audience data, automate personalized content creation, and track the ROI of your social media engagement strategies in real time. Visit marketbetter.ai to see how you can turn these powerful strategies into predictable business growth.

Best AI Tools for Content Marketing in 2026 (Ranked by ROI — Not Hype)

· 35 min read

The landscape of content marketing is rapidly evolving, driven by powerful AI that goes far beyond simple text generation. In 2025, winning teams aren't just creating content faster; they're using AI to strategize, optimize, personalize, and measure impact across the entire customer journey. The challenge is no longer if you should use AI, but which ai tools for content marketing provide the right capabilities to solve your specific pain points.

This guide moves past the hype to deliver an actionable, in-depth comparison of the top platforms available today. We dissect their core strengths, reveal practical use cases, and provide honest assessments of their limitations, empowering you to choose the right platform to drive measurable growth and efficiency. Before diving into specific applications, understanding what is generative AI provides crucial context for how these tools are transforming content marketing from ideation to distribution.

Our goal is to help you find the best solution for your unique needs, whether you're a CMO scaling a global team, a demand generation manager focused on SEO, or an entrepreneur needing to do more with less. We'll explore everything from comprehensive content hubs like HubSpot and Semrush to specialized writing assistants like Jasper and Grammarly.

Each platform profile includes detailed feature analysis, screenshots, direct links, and pricing breakdowns to make your decision process straightforward and effective. This resource is designed to be your definitive guide for integrating the most effective ai tools for content marketing into your 2025 strategy and beyond.

1. marketbetter.ai

As our featured choice, marketbetter.ai stands out as a premier end-to-end platform among AI tools for content marketing, specifically engineered for mid-market to enterprise B2B teams. It moves beyond single-point solutions like content generators or simple schedulers by providing a fully integrated, AI-native ecosystem. This unified approach connects content creation, campaign optimization, and personalized customer engagement into a cohesive and powerful workflow, eliminating the data silos and inefficiencies common with a fragmented MarTech stack.

marketbetter.ai

Core Strengths and Use Cases

What truly distinguishes marketbetter.ai is its ability to translate go-to-market signals into actionable pipeline. The platform's predictive analytics engine helps demand generation managers identify high-intent accounts and optimize budget allocation before a campaign even launches. For content teams, it offers up to 5x faster production of high-quality, on-brand assets, from blog posts to email sequences, all informed by real-time performance data. Where tools like HubSpot connect content to CRM data, marketbetter.ai focuses specifically on linking GTM signals to revenue, providing a clearer line-of-sight on ROI for B2B teams.

A key practical benefit is its automation capability, which handles up to 80% of manual outreach tasks. This includes prospect research, crafting personalized multichannel messages, and executing follow-up sequences, freeing up sales and marketing teams to focus on strategic initiatives rather than repetitive work. For a deeper dive into their methodology, explore their guide on how to scale content marketing with AI.

Implementation and User Experience

marketbetter.ai is built for seamless integration with essential CRMs like Salesforce and HubSpot, ensuring a smooth transition and a single source of truth for GTM teams. While the platform is robust, its dashboards are designed for clarity, providing advanced attribution modeling that CMOs and VPs of Sales can use to measure ROI accurately. Its high rating on G2 (4.97/5) reflects strong customer satisfaction, particularly praising its impact on generating qualified demos and accelerating the sales cycle.

Feature Analysismarketbetter.aiTypical Point Solutions
Workflow IntegrationUnified content, campaign, & outreach in one platformRequires multiple tools, manual data sync, and API keys
Content GenerationAI-driven, on-brand, and tied to performance analyticsGeneric output, often disconnected from campaign goals
Audience TargetingPredictive segmentation based on real-time GTM signalsStatic lists or basic demographic filtering
ROI MeasurementAdvanced attribution modeling across the full funnelLimited to channel-specific metrics (e.g., open rates)

Pricing and Onboarding

Pricing for marketbetter.ai is provided through customized quotes, a common practice for enterprise-grade solutions tailored to specific business needs. This approach ensures you only pay for the capabilities you require but does necessitate a direct sales conversation. The platform's superior customer support is frequently highlighted in reviews, assisting with onboarding and helping users navigate any initial learning curve when moving from disparate legacy systems.

  • Pros:
    • All-in-one platform integrating content creation, campaign management, and customer engagement.
    • Proven to accelerate pipeline with measurable lifts in SQLs and qualified demos.
    • Seamless, cost-free integrations with major CRMs and marketing tools.
  • Cons:
    • Lack of public pricing can be a barrier for initial evaluation.
    • May present a learning curve for teams accustomed to simpler, single-function tools.

Website: https://www.marketbetter.ai

2. Jasper

Jasper positions itself as a premier AI co-pilot specifically for marketing teams, moving beyond simple text generation to offer a comprehensive, brand-aligned content production environment. Its core strength lies in its ability to maintain brand consistency at scale, a critical challenge for growing organizations. Unlike more generalist AI writing assistants like ChatGPT, Jasper is built with team collaboration and governance at its center, making it one of the most effective ai tools for content marketing for enterprise use.

The platform's standout features, Brand Voice and Knowledge, allow users to upload brand guides, product documentation, and style guidelines. The AI then uses this information to generate content that is consistently on-brand, accurate, and relevant to a specific audience profile. This grounding mechanism significantly reduces the need for extensive editing and fact-checking, which is a common pain point with other generative AI tools.

Jasper

Key Features and Use Cases

  • Campaign Workflows: Jasper's "Canvas" feature provides a collaborative space where teams can map out entire campaigns, from initial brainstorming to final asset creation and repurposing. For instance, a marketing manager can create a workflow that takes a webinar transcript, turns it into a blog post, generates social media updates, and drafts an email newsletter, all within one interconnected project.
  • Brand Voice & Knowledge: Upload your style guides, messaging pillars, and product catalogs to create a centralized knowledge base. This ensures that every piece of content, whether a Facebook ad or a technical blog post, adheres to your company's unique tone and factual accuracy.
  • Team Collaboration & Governance: The platform includes robust user management, content review workflows, and admin controls. This is ideal for larger teams needing to maintain quality and consistency across all contributors.

Pricing and Implementation

Jasper offers several tiers, with pricing structured on a per-seat basis.

  • Creator: Ideal for individual entrepreneurs and marketers.
  • Pro: Starts at $59/seat/month (billed annually) and unlocks Brand Voices, collaboration features, and a 7-day free trial.
  • Business: Custom pricing for organizations needing advanced features like API access, custom AI models, and enterprise-grade security.

Actionable Tip: To maximize Jasper's value, invest time upfront in building a comprehensive Brand Voice and Knowledge base. Upload your top-performing blog posts, company one-pagers, and style guides to give the AI a rich data set to learn from. This initial setup is key to achieving high-quality, on-brand outputs.

Pros & Cons

ProsCons
Excellent for maintaining brand consistencyBusiness tier pricing requires a custom quote
Purpose-built for marketing team collaborationPer-seat model can become costly for large teams
7-day free trial for the Pro planAdvanced features are locked behind enterprise plans

Website: https://www.jasper.ai/pricing

3. Copy.ai

Copy.ai positions itself as a highly accessible yet powerful platform, excelling in both on-demand content generation and automated marketing workflows. Its unique value proposition is the combination of an intuitive chat interface with a sophisticated "Agents" feature, allowing teams to automate repetitive content tasks. While Jasper focuses on enterprise-level brand governance, Copy.ai provides an excellent on-ramp for smaller teams and solo marketers looking to scale operations, making it one of the most versatile ai tools for content marketing.

The platform stands out by offering access to multiple large language models (LLMs) through its chat interface, allowing users to choose the best engine for a specific task. However, its true power lies in the Workflow builder, where users can create custom "Agents" to automate processes like generating blog briefs from keywords, repurposing content for different channels, or creating product descriptions in bulk.

Copy.ai

Key Features and Use Cases

  • Chat by Copy.ai: An intuitive interface offering unlimited words and access to multiple LLMs. It's ideal for quick-turnaround tasks like writing social media posts, drafting emails, or brainstorming blog post ideas without worrying about word count limits.
  • Workflow Automation: Build custom "Agents" that perform multi-step content tasks automatically. For example, a content manager can create an agent that takes a target keyword, researches competitors, generates a detailed brief, and then writes a first draft of an SEO-optimized blog post.
  • Brand Voice: Similar to other platforms, you can input brand information, style guides, and key messaging. This ensures that whether you're using the chat or an automated workflow, the output aligns with your company’s established tone and voice.

Pricing and Implementation

Copy.ai offers a simple pricing structure with a free tier for individuals.

  • Free: For one user, offering 2,000 words in the editor and limited chat functionality.
  • Pro: Starts at $36/month (billed annually) for 5 seats, providing unlimited words in chat and a set number of workflow credits.
  • Agent: Starts at $300/month (billed annually) for 20 seats, designed for teams needing to scale automation with a higher allocation of workflow credits.

Actionable Tip: Start by identifying your most time-consuming, repetitive content task. Use the Workflow builder to create a simple agent for that specific process, such as turning customer testimonials into social media posts. This provides a clear proof-of-concept for its automation capabilities before you invest heavily in more complex workflows.

Pros & Cons

ProsCons
Simple on-ramp with an accessible Pro planWorkflow credits may require add-ons as usage grows
Multi-model access provides flexibilityAgent tier for advanced automation is a significant price jump
Powerful workflow automation for scaling contentLess focus on deep team governance than enterprise tools

Website: https://www.copy.ai/prices

4. HubSpot Content Hub + Breeze AI

HubSpot Content Hub integrates its new Breeze AI agents directly into its marketing, CMS, and CRM platform, creating a unified ecosystem for content creation, management, and performance analysis. This all-in-one approach is its key differentiator; rather than being a standalone tool, it uses CRM data to inform content strategy and measure ROI. For teams already invested in the HubSpot ecosystem, this makes it one of the most powerful and seamless ai tools for content marketing available, as it connects content generation directly to lead generation and customer data.

The platform's strength lies in its ability to manage the entire content lifecycle within a single environment. While marketbetter.ai focuses on integrating GTM signals for B2B pipeline, HubSpot's advantage is its deep integration across marketing, sales, and service hubs, providing a complete view of the customer journey. From generating a blog post to tracking its influence on deals, the workflow is entirely interconnected.

HubSpot Content Hub + Breeze AI

Key Features and Use Cases

  • CRM-Grounded Content Creation: Use Breeze AI to generate blog posts, landing pages, and emails that are informed by your CRM data. For example, you can create content personalized for specific customer segments or based on insights from high-performing sales sequences.
  • Content Remix: This feature allows you to instantly repurpose existing assets. Turn a long-form blog post into a series of social media updates, a knowledge base article, or an email newsletter, all while maintaining brand consistency with the Brand Voice feature.
  • End-to-End Campaign Management: The beta content agent allows for the assembly of entire campaigns from a single brief. Describe your campaign goal, and the AI can generate a core pillar page, related blog posts, and promotional emails, streamlining the entire content production process.

Pricing and Implementation

HubSpot Content Hub is available in several tiers, with AI features scaling up with each plan.

  • Starter: Begins at $15/seat/month (billed annually) with basic content and AI tools.
  • Professional: Starts at $450/month (includes 3 seats) and unlocks more advanced features like Content Remix and deeper analytics.
  • Enterprise: Starts at $1,500/month (includes 5 seats) for comprehensive governance, reporting, and advanced AI capabilities.

Actionable Tip: Connect your HubSpot CRM and website analytics from day one. Use the performance data of your existing, non-AI content to identify top-performing topics and formats. Then, use Breeze AI's Content Remix to scale what already works, creating variations of your most successful assets for different channels.

Pros & Cons

ProsCons
Deeply integrated into CMS/CRM for distributionMost powerful AI features are in Pro/Enterprise tiers
End-to-end content lifecycle managementPlatform breadth can be overwhelming for small teams
Enterprise-ready governance and multi-channel publishingHigher price point compared to standalone AI tools

Website: https://www.hubspot.com/products/content-hub

5. Semrush

Semrush evolves from its roots as a premier SEO platform into a comprehensive content marketing suite by integrating powerful AI capabilities. Its unique proposition is the deep connection between SEO data and content creation, allowing marketers to draft and optimize content within the same ecosystem where they conduct keyword research and competitive analysis. Unlike standalone AI writers like Jasper, Semrush’s tools are inherently data-informed, making it one of the most strategic ai tools for content marketing for teams focused on organic growth.

The platform's strength lies in its Content Marketing Toolkit, which uses AI to guide the entire content lifecycle. It helps ideate topics based on real-time search data and then provides AI-driven assistance to write and optimize the content for search engines. This seamless workflow closes the gap between SEO strategy and content execution, ensuring every article is crafted with a clear path to ranking from the very beginning.

Key Features and Use Cases

  • Content Marketing Toolkit: This suite allows users to find keyword-driven topic ideas, generate AI article drafts, and then optimize them for search. A content manager can use it to identify a competitor's ranking weakness, generate a comprehensive article outline, draft the content with AI, and then refine it using real-time SEO suggestions.
  • SEO Writing Assistant: This feature provides on-the-fly recommendations within your text editor (integrates with Google Docs, WordPress, and MS Word). It analyzes your content for readability, tone of voice, keyword usage, and originality, ensuring it meets SEO best practices before you publish.
  • AI-Powered Idea Generation: Semrush uses AI to analyze SERPs and suggest content topics and questions your audience is actively searching for. This is perfect for brainstorming blog posts, FAQs, or pillar pages that are virtually guaranteed to have audience interest.

Pricing and Implementation

Semrush plans bundle various tools, with AI features often included in higher-tier plans.

  • Pro: Starts at $129.95/month, focused on core SEO and research tools.
  • Guru: Starts at $229.95/month, includes the Content Marketing Platform and more extensive limits.
  • Business: Starts at $499.95/month for agencies and large enterprises with the highest limits and API access.

Actionable Tip: Use the SEO Writing Assistant integration for Google Docs. Before handing off a draft to an AI writer, create a new document, paste in your target keywords, and run the Semrush add-on. This gives your AI tool a pre-optimized template to work from, ensuring the generated content is aligned with SEO goals from the start.

Pros & Cons

ProsCons
Seamlessly integrates SEO data with AI writingAI features require more expensive Guru or Business plans
Centralizes the entire SEO and content workflowAI writing credits and limits can be restrictive on lower tiers
Integrates directly into Google Docs and WordPressThe platform can be complex for beginners not focused on SEO

Website: https://www.semrush.com/

6. Surfer

Surfer bridges the gap between AI-driven content creation and data-backed on-page SEO optimization. It distinguishes itself by focusing explicitly on what it takes to rank on Google, analyzing top-performing pages to provide a clear, actionable roadmap for content creation and optimization. While Semrush offers a broader marketing toolkit, Surfer provides a more targeted, specialist approach to on-page SEO. This makes it one of the most effective ai tools for content marketing for teams aiming for organic traffic growth.

The platform provides a data-centric environment where writers and SEOs can collaborate to create content engineered to meet search engine expectations. Surfer’s AI analyzes competing articles for structure, keyword density, and topical relevance, then presents these insights in an easy-to-use editor. This reverse-engineering approach removes much of the guesswork from SEO content creation, providing a clear path to improving search visibility.

Surfer

Key Features and Use Cases

  • Content Editor with Scoring: The primary feature where users write or paste content to receive a real-time optimization score from 0-100. It offers specific suggestions on keyword usage, heading structure, and word count based on a direct analysis of top-ranking competitors for a target query.
  • Content Audit: Run an existing URL through the Audit tool to get actionable on-page SEO recommendations. This is perfect for content refresh campaigns, identifying missing keywords and internal link opportunities to boost the performance of older posts.
  • Topic Discovery & Keyword Research: Surfer helps generate clusters of related topics and keywords around a central theme, allowing marketers to build out comprehensive pillar pages and content hubs that establish topical authority.

Pricing and Implementation

Surfer’s pricing is based on feature access and usage credits for its tools.

  • Essential: Starts at $89/month (billed annually) for individuals and small teams.
  • Advanced: At $179/month (billed annually), it includes more credits and team management features.
  • Max: At $299/month (billed annually), it offers the highest credit limits and API access.

Actionable Tip: Use the Google Docs or WordPress integration to streamline your workflow. This allows your writers to work in their preferred environment while still getting live SEO feedback from Surfer's Content Editor, reducing the friction between content creation and optimization.

Pros & Cons

ProsCons
Clear guidance on what to optimize based on SERP dataMost value realized at higher-tier Scale or Enterprise plans
Excellent for both new content creation and existing auditsLearning curve for users new to SEO optimization tools
Integrates directly with Google Docs and WordPressCan promote an over-reliance on scores vs. user intent

Website: https://surferseo.com/pricing/

7. Writesonic

Writesonic positions itself as an all-in-one AI-powered marketing suite, aiming to consolidate the content creation and SEO optimization tool stack. Its primary differentiator is its breadth, combining a powerful AI article writer with SEO research, optimization tools, and performance tracking. Where Surfer and Semrush are SEO tools that added AI writing, Writesonic feels more like an AI writer that has built a robust SEO toolkit around it. This makes it a compelling option for marketers looking to manage the entire content lifecycle within a single platform.

The platform's versatility is enhanced by its support for multiple AI models, including GPT-4o and Claude, allowing users to select the best engine for their specific task. This multi-model approach gives content creators more flexibility and control over the output's style, tone, and quality, which can be a significant advantage over single-model platforms.

Writesonic

Key Features and Use Cases

  • AI Article Writer & Optimization: The core feature allows users to generate SEO-friendly articles of up to 5,000 words. It incorporates real-time SERP data to inform content structure and includes an optimization engine similar to SurferSEO, providing a content score and suggestions for improvement.
  • SEO Audits and Fixes: Writesonic can perform technical and on-page SEO audits of your entire website. It identifies issues like broken links, missing meta descriptions, and slow page speed, often providing AI-driven suggestions for quick fixes.
  • GEO Tracking & AI Bot Monitoring: For businesses focused on local SEO, the platform offers rank tracking by geographical location. It also includes tools to identify and monitor AI bot traffic, helping to maintain data accuracy in analytics.

Pricing and Implementation

Writesonic offers various plans based on word count, features, and user seats.

  • Free Trial: A limited free plan is available to test the platform.
  • Business: Starts at $19/month for one user, providing access to premium features and higher-quality word generation.
  • Enterprise: Custom pricing for larger teams needing unlimited usage, advanced security features, and dedicated support.

Actionable Tip: When using the AI Article Writer, always start by analyzing the top-ranking competitor articles within the tool itself. Writesonic pulls this data in, allowing you to identify content gaps and structure your brief more effectively before you ask the AI to generate the full draft. This initial research step drastically improves the first draft's relevance and quality.

Pros & Cons

ProsCons
Broad feature set reduces the need for multiple toolsPricing and plan complexity can be confusing
Multi-model AI support (GPT-4o, Claude)The best features are locked behind higher-tier plans
Integrated SEO optimization and auditing toolsPer-user costs can add up for larger teams

Website: https://writesonic.com/pricing

8. Canva Magic Studio (Magic Write)

Canva has evolved from a graphic design tool into a comprehensive visual communication platform, with Magic Studio at its core. It integrates powerful AI copywriting and design features directly into the creation workflow, making it an indispensable tool for teams that prioritize visually-led content. Unlike standalone AI writers like Jasper or Copy.ai, Canva's strength is its ability to generate both text and visuals simultaneously, streamlining the creation of social media posts, ads, and presentations from start to finish. This makes it one of the most efficient ai tools for content marketing for producing high volumes of visual assets.

Magic Studio’s key feature, Magic Write, allows users to generate copy with a defined Brand Voice, ensuring that text inside designs remains consistent. This integration is a significant advantage over workflows that require copy-pasting text from a separate AI tool into a design platform. It bridges the gap between copywriting and design, enabling a single creator to manage the entire content lifecycle. For those looking to streamline their visual content, discover more about powerful social media content creation tools that can amplify your strategy.

Canva Magic Studio (Magic Write)

Key Features and Use Cases

  • Integrated Copy and Design: Use Magic Write to instantly generate headlines, body copy, or calls-to-action directly within a social media template or presentation slide. This is ideal for quickly creating multiple ad variations or social posts for A/B testing.
  • Brand Voice Management: Set up a Brand Kit with your logos, colors, fonts, and tone of voice guidelines. Magic Write will use this to generate copy that aligns with your brand identity, ensuring consistency across all visual content.
  • Content Repurposing: The Magic Switch feature (formerly Magic Resize) allows you to transform one asset into many. For instance, you can turn a long-form presentation into a summary document, a blog post, or a series of LinkedIn carousel posts with a single click, saving hours of manual reformatting.

Pricing and Implementation

Canva offers a generous free plan with limited Magic Studio uses.

  • Free: Includes limited uses of Magic Studio tools.
  • Pro: Starts at $14.99/month for one person, with significantly more Magic Studio credits and access to premium features.
  • Teams: Starts at $29.99/month for the first 5 people, providing centralized brand management, collaboration tools, and pooled credits.

Actionable Tip: Use the "Bulk Create" app to streamline repetitive design tasks. Prepare your copy variations in a CSV file (e.g., different testimonials or product features) and upload it to Canva to automatically generate dozens of unique social media graphics from a single template.

Pros & Cons

ProsCons
All-in-one platform for visual and text creationNot a dedicated SEO or long-form blog writing tool
Excellent for social media and ad contentTeam pricing can be costly for smaller businesses
Generous free tier for AI feature testingAI features are credit-based, which may limit high-volume users

Website: https://www.canva.com/magic/

9. Grammarly Business

Grammarly Business elevates the popular AI-powered writing assistant into a comprehensive tool for ensuring content quality and brand consistency across an entire organization. While many AI tools focus on content generation, Grammarly excels at the crucial final steps of polishing and refining copy. It acts as an ever-present editor, ensuring every email, social post, and blog article meets a high standard of correctness, clarity, and on-brand tone. For teams focused on quality control over speed, it is one of the most foundational ai tools for content marketing.

The platform's strength lies in its low-friction integration and its ability to enforce a consistent writing style at scale. Unlike platforms focused purely on creation, Grammarly integrates directly into the tools your team already uses, from Google Docs to your CRM. The Business plan adds centralized management features like Style Guides and Brand Tones, allowing a marketing leader to define specific rules (e.g., "always use sentence case in headlines") that are then suggested to every team member in real-time.

Grammarly Business

Key Features and Use Cases

  • Style Guides & Brand Tones: A content manager can codify brand-specific terminology, capitalization rules, and stylistic preferences. This ensures that a new hire's client email sounds just as on-brand as a veteran marketer's blog post, automatically enforcing consistency.
  • Real-Time Writing Assistance: Beyond simple spell-checking, the AI provides suggestions for clarity, conciseness, tone (e.g., confident, analytical), and engagement. This helps polish everything from ad copy to internal communications.
  • Team Analytics and Management: Admins can view usage statistics and common writing challenges across the team, identifying opportunities for targeted training. Centralized billing and user management simplify onboarding and administration for growing teams.

Pricing and Implementation

Grammarly Business uses a per-user pricing model, requiring a minimum number of seats.

  • Premium: For individuals, starting at $12/month.
  • Business: Starts at $15/user/month (billed annually) for teams of 3 to 149. Includes Style Guides, Brand Tones, and analytics.
  • Enterprise: Custom pricing for larger organizations needing advanced security (SAML SSO), a dedicated success manager, and enhanced controls.

Actionable Tip: Implement the Style Guide feature immediately. Start by adding your company name, key product names, and common industry jargon to prevent misspellings. Then, add rules for common stylistic errors you frequently correct, such as a preference for the Oxford comma or specific headline capitalization, to automate your editing process.

Pros & Cons

ProsCons
Seamless integration across browsers and appsNot a primary content generation or SEO tool
Improves baseline quality of all written contentPer-seat model requires a minimum of 3 users
Easy to deploy and adopt across a teamGenerative AI features are less advanced than dedicated tools

Website: https://www.grammarly.com/business/pricing

10. Notion AI

Notion AI transforms the popular collaborative workspace into a powerful content engine, embedding generative AI directly into the tools marketing teams already use for planning and documentation. Where standalone AI writers focus solely on creation, Notion AI's strength is its integration within a unified content operations hub. For teams that live in Notion for project management, it is an indispensable ai tool for content marketing for streamlining the entire content lifecycle, from ideation and briefing to drafting and final review, all in one place.

The platform excels at applying AI to structured data within its databases and project pages. Unlike tools that only generate text in a blank document, Notion AI can summarize meeting notes, draft content briefs based on database properties, translate text blocks, and even autofill database columns. This contextual AI capability dramatically reduces manual work and ensures consistency across related content assets.

Notion AI

Key Features and Use Cases

  • Integrated Writing and Summarization: Instantly draft outlines, write first drafts of blog posts, or summarize long research documents directly within a Notion page. A content manager can highlight notes from a strategy session and ask the AI to generate a content brief, complete with target keywords and audience profiles.
  • Database Autofill: Automate metadata creation in your content calendar. Use AI to generate social media captions, SEO meta descriptions, or content summaries for each item in your database, saving hours of repetitive data entry.
  • Contextual Q&A: Notion's "Q&A" feature acts like a personalized search engine for your workspace. A team member can ask, "What are our key messaging points for the Q3 campaign?" and the AI will scan relevant documents to provide a direct, synthesized answer.

Pricing and Implementation

Notion includes the AI add-on with its higher-tier plans for new customers, with options for existing users.

  • Plus: Starts at $10/user/month (billed annually) and serves as the base for the AI add-on.
  • Business: Starts at $18/user/month and includes the Notion AI features.
  • Enterprise: Custom pricing for advanced controls, security, and dedicated support.

Actionable Tip: Create database templates for your core content types (e.g., blog posts, case studies) with an "AI Summary" property. Set up a button automation that, when clicked, uses Notion AI to read the page content and populate that summary field automatically, creating at-a-glance overviews for your content calendar.

Pros & Cons

ProsCons
Unifies content strategy, planning, and creationAI features are tied to more expensive plans
AI is applied directly to structured workflows and dataRecent pricing changes can be confusing for existing users
Excellent for team collaboration and documentationNot as feature-rich for pure writing as dedicated AI tools

Website: https://www.notion.so/pricing

11. OpenAI ChatGPT (Plus/Business/Enterprise)

OpenAI's ChatGPT has evolved from a general-purpose conversational AI into a robust workspace that marketers can leverage for a wide array of content tasks. It serves as a highly versatile assistant for everything from initial audience research and brainstorming to drafting copy, repurposing content, and creating custom workflows. Unlike specialized platforms like Surfer or Jasper, its strength lies in its flexibility, making it one of the most adaptable ai tools for content marketing for teams that need a multipurpose solution.

The platform's Business and Enterprise tiers add crucial layers of collaboration, administration, and data privacy, transforming it from a solo tool into a secure team environment. Features like shared workspaces and admin controls allow marketing leaders to manage usage and maintain oversight. This makes it a powerful supplement to a core marketing stack, filling gaps in ideation, rapid drafting, and strategic analysis. It is an excellent starting point for teams looking to understand how to use AI in marketing before committing to more specialized tools.

OpenAI ChatGPT (Plus/Business/Enterprise)

Key Features and Use Cases

  • Custom GPTs: Teams can build specialized internal tools without coding. For example, a content manager could create a "Blog Brief GPT" trained on the company's SEO guidelines and audience personas to standardize content outlines for all writers.
  • Data Analysis & Research: Users can upload spreadsheets of market research, keyword data, or performance metrics and ask the AI to identify trends, summarize findings, or generate charts. This is useful for quickly analyzing campaign results to inform the next content cycle.
  • Team Workspace & Admin Controls: The Business and Enterprise plans provide a central environment where team members can collaborate on projects. Admins can manage user access and ensure data from conversations is not used for model training, which is critical for compliance.

Pricing and Implementation

ChatGPT offers several plans catering to different user needs.

  • Free: Access to the base model with usage limits.
  • Plus: $20/user/month for individuals needing access to advanced models like GPT-4, DALL-E 3, and data analysis.
  • Business/Enterprise: Custom pricing for teams requiring collaboration features, enhanced security, admin controls, and higher usage limits.

Actionable Tip: Use the Custom GPTs feature to build a "Brand Voice & Tone Checker." Feed it your style guide, examples of on-brand copy, and a list of words to avoid. Your team can then run their drafts through this custom GPT for a quick consistency check before publishing.

Pros & Cons

ProsCons
Highly versatile for ideation and draftingNot a dedicated SEO or content management platform
Enterprise-grade controls for teamsUsage limits can vary by plan
Custom GPTs allow for tailored workflowsRequires manual brand voice governance

Website: https://openai.com/pricing

12. G2 - AI Writing Assistants category

While not a tool itself, G2's AI Writing Assistants category is an indispensable research hub for any marketing leader evaluating software. It serves as a comprehensive marketplace, aggregating real user reviews, detailed feature comparisons, and up-to-date rankings. Instead of relying solely on vendor marketing, G2 provides a peer-validated starting point, making it one of the most strategic resources for discovering and shortlisting ai tools for content marketing that fit specific organizational needs.

The platform excels at helping users cut through the noise of a rapidly growing market. By leveraging its powerful filtering and comparison grids, marketing managers can quickly identify top-rated solutions based on company size, industry, or specific feature requirements. This data-driven approach allows teams to compare alternatives side-by-side, understand user-reported limitations, and make more informed purchasing decisions without extensive manual research.

Key Features and Use Cases

  • Peer Reviews & Comparison Grids: Directly compare the top AI writing platforms on features, ease of use, and quality of support based on feedback from verified users. A demand generation manager could use this to compare Jasper and Copy.ai based on ratings from mid-market B2B tech companies.
  • Quarterly Reports & Rankings: Access G2's "Grid" reports, which plot tools based on market presence and customer satisfaction. This is useful for identifying established leaders versus high-momentum "challenger" tools.
  • Discovery of Niche Tools: Beyond the big names, the platform helps uncover emerging or specialized AI tools that might be a better fit for a unique use case, like AI-powered video scriptwriting or technical documentation.

Pricing and Implementation

G2 is a free resource for software buyers. Access to all reviews, comparison tools, and reports does not require a paid subscription. Vendors may have sponsored listings, which are clearly marked.

Actionable Tip: Use the filtering options to narrow down choices to your specific industry and company size. Reviews from users with a similar profile are far more relevant than the overall score. Pay close attention to reviews mentioning integration capabilities with your existing martech stack (e.g., HubSpot, Salesforce).

Pros & Cons

ProsCons
Aggregates verified, real-world user feedbackSponsored placements can influence visibility
Excellent for comparing features side-by-sideNiche or newer tools may have very few reviews
Free to use for research and shortlistingReview quality can be inconsistent

Website: https://www.g2.com/categories/ai-writing-assistant

AI Content Marketing Tools Comparison

PlatformCore Features & CapabilitiesUser Experience & Quality ★Value Proposition & Pricing 💰Target Audience 👥Unique Selling Points ✨
marketbetter.ai 🏆End-to-end AI marketing: content, campaigns, CRM★★★★★ (4.97/5), top-rated on G2Customized pricing; ROI-focused, 5x faster content, 15% better conversionsMid-market to enterprise B2B marketing teamsUnified AI across content, campaigns & engagement; 80% outreach automation
JasperBrand-safe AI content, campaign workflows★★★★☆, strong governanceQuote-based pricing; per-seat may add costsMarketing teams needing brand controlBrand Voices, No-code AI App Builder
Copy.aiAI chat content creation, workflow automation★★★★☆Low monthly start; workflow credit systemSmall marketing teams scaling contentMulti-model AI and scalable agents
HubSpot Content Hub + Breeze AIAI blog, email, website generation; CRM integration★★★★☆ Enterprise-gradeBest AI features in higher tiersEnterprise marketing teamsDeep CRM/automation integration
SemrushSEO-focused AI writing & optimization tools★★★★Higher tiers/add-ons for full AI featuresSEO-driven content marketersSEO data + AI writing combined
SurferAI content creation & on-page SEO optimization★★★★Scale and Enterprise plans unlock full valueSEO specialists focusing on Google rankingGEO tracking & AI visibility insights
WritesonicSEO research, article writing & optimization★★★★Complex pricing; add-on costsBroad content & SEO marketersMulti-model AI including GPT-4o
Canva Magic Studio (Magic Write)AI copywriting with design & brand voice★★★★Freemium available; team plans costlySocial media & visual content creatorsBulk content & repurposing; extensive templates
Grammarly BusinessAI writing assistant focused on clarity & style★★★★☆Per-seat pricing; team minimumsTeams focused on quality and consistencyBrand style enforcement & real-time feedback
Notion AIAI-enhanced collaborative workspace★★★★AI in Business/Enterprise plansCross-team content plannersAI for structured content & workflows
OpenAI ChatGPT (Plus/Business/Enterprise)Versatile AI assistant & custom GPT workflows★★★★Subscription tiers; usage limits applyMarketers needing flexible AI assistantCustom GPTs & advanced collaboration features
G2 - AI Writing Assistants categoryUser reviews & rankings of AI marketing toolsN/AFree accessBuyers researching marketing AI toolsPeer reviews & comprehensive comparisons
Free Tool

Try our Marketing Plan Generator — generate a complete AI-powered marketing plan in minutes. No signup required.

Making Your Choice: From Content Velocity to Business Velocity

Navigating the expansive landscape of AI tools for content marketing can feel overwhelming, but the journey from exploration to implementation is a strategic one. We've dissected a dozen powerful platforms, from all-in-one campaign engines to specialized SEO assistants and nimble content generators. The core takeaway is clear: the "best" tool doesn't exist in a vacuum. It exists in the context of your team's specific bottlenecks, strategic goals, and operational maturity.

The shift from manual content creation to an AI-augmented workflow is no longer just about increasing content velocity. It's about achieving business velocity. It's about collapsing the time between ideation and revenue, between a blog post and a closed deal, and between data analysis and a winning campaign pivot.

From Tool-Specific Skills to Strategic Integration

The tools we've covered represent distinct philosophies. Platforms like Jasper, Copy.ai, and Writesonic are masters of generation, empowering teams to overcome the blank page and produce high volumes of creative copy. They are the specialists you hire for a specific, critical task: writing.

In contrast, SEO-centric tools like Semrush and Surfer act as your strategic advisors. They don't just write; they provide the data-driven blueprint for what to write, ensuring your content has the best possible chance to rank and attract organic traffic. Similarly, tools like Grammarly Business and Canva Magic Studio integrate AI into existing workflows, enhancing quality and visual appeal without requiring a complete process overhaul.

Then there are the integrated ecosystem players. HubSpot Content Hub and Notion AI embed AI directly into the platforms where your marketing and business operations already live. This approach prioritizes seamless workflows and centralized knowledge over best-in-class, single-point solutions.

A Framework for Your Decision

To make the right choice, move beyond feature-for-feature comparisons and ask these critical questions about your organization's primary needs:

  • Is our biggest challenge proving ROI? If your C-suite constantly asks, "How is marketing driving revenue?" then a platform that connects content directly to the sales funnel is essential. An integrated solution like marketbetter.ai, which links content assets to lead generation and sales outcomes, provides the attribution and reporting needed to justify your budget and demonstrate impact.
  • Is our primary bottleneck content creation speed? If your team struggles to keep up with the content calendar, a dedicated AI writer is your best bet. A tool like Jasper with its robust templates and brand voice features, or Copy.ai with its workflow automation, can dramatically increase your team’s output.
  • Is our main goal to dominate search rankings? For teams where organic traffic is the lifeblood of lead generation, an SEO-focused platform is non-negotiable. The deep keyword research, competitive analysis, and on-page optimization guidance from Semrush or Surfer will provide a far greater return than a generic writing tool.
  • Do we need better team collaboration and governance? If your content process is chaotic, with inconsistent branding and multiple disconnected tools, consider a platform that unifies the workflow. Notion AI can centralize planning and drafting, while enterprise-grade solutions offer the governance features needed to maintain brand integrity at scale.

Ultimately, selecting the right AI tools for content marketing is an act of strategic self-assessment. Identify your most significant point of friction, whether it's creation, optimization, management, or measurement. The right platform won't just help you create more content faster; it will transform your entire marketing engine into a more efficient, predictable, and powerful driver of business growth.


Ready to move beyond simple content generation and connect your marketing efforts directly to revenue? marketbetter.ai is the AI-powered platform designed to manage your entire content-to-close funnel, providing the clear attribution you need to prove ROI. See how our integrated approach makes marketbetter.ai one of the most strategic ai tools for content marketing by exploring our platform today.

AI Lead Generation in 2026: 11 Tools, Real Costs, and What Actually Converts

· 24 min read

Lead generation AI is the strategic use of intelligent technology to find, qualify, and connect with potential customers. It transforms the traditional, manual playbook into a data-driven, predictive system that works smarter, not harder. The actionable result? Radically improved efficiency and a significant increase in closed deals.

The End of Guesswork in Lead Generation

A modern dashboard showing business analytics and charts, symbolizing AI-driven precision in marketing.

Imagine the difference between dragging a massive fishing net hoping to catch something and using a high-tech sonar that pinpoints exactly where the prize fish are swimming. That’s the leap from old-school lead gen to an AI-powered strategy. The best businesses are ditching the high-effort, low-return grind for the sharp precision of lead generation AI.

This isn't just about making things faster; it's a complete shift away from wishful thinking and toward predictable results. The old way was a messy affair of casting a wide net with generic campaigns, dialing down cold-call lists, and manually sifting through piles of unqualified names. It was a time-suck that left sales teams chasing dead ends.

From Manual Labor to Intelligent Strategy

Traditional methods are all about elbow grease and gut feelings. A marketing team might spend weeks cooking up a campaign based on loose demographic data, crossing their fingers that it lands. A sales rep could burn 80% of their day on tasks that don’t generate revenue, like digging for contact info and trying to qualify prospects.

Contrast that with an AI-driven approach. It automates the grunt work but does so with an intelligence a human can't match at scale. AI can analyze thousands of data points in a split second, flagging prospects who not only fit your ideal customer profile but are also actively showing signs they're ready to buy right now.

The real difference is simple. Old methods ask, "Who could we possibly sell to?" AI answers, "Who is most likely to buy, and what do we need to say to them?" This frees your team up to do what they do best: build relationships with people who actually want to talk.

The Old Way vs. The New Way: A Practical Comparison

When you put the two approaches side-by-side, the contrast is stark. This isn't just theory; it's a fundamental change in daily workflow and results.

TaskTraditional Lead Generation (The Old Way)Lead Generation AI (The New Way)Actionable Advantage
Lead SourcingManual list building, trade shows, generic ads.Predictive analytics identifies high-intent accounts.Focus your budget on accounts that are already showing buying signals.
QualificationManual BANT questions, subjective scoring.Automated lead scoring based on behavior & data.Your sales team only spends time on leads vetted by data, not guesswork.
PersonalizationUses basic fields like First_Name and Company.Hyper-personalization based on real-time behavior.Craft outreach that references a prospect's recent activity for higher reply rates.
EfficiencyHigh manual effort, slow response times.Automated workflows, 24/7 engagement via chatbots.Engage leads instantly, even outside business hours, preventing them from going to a competitor.

This isn't just a "nice to have" upgrade. The way people buy has fundamentally changed. Enterprise deals now involve more decision-makers and take longer to close, and every one of those people expects a relevant, personalized conversation. The tactics that were "good enough" a few years ago just don't cut it anymore. By adopting lead generation AI, you empower your team to stop chasing ghosts and start closing deals with your most valuable prospects.

How AI Learns to Find Your Best Leads

You don't need a computer science degree to understand how AI finds great leads. The easiest way to think about it is hiring a team of virtual specialists, each with a specific superpower. These specialists aren't magical—they're just core technologies that get incredibly good at learning from data to pinpoint your next best customer.

It all starts and ends with data. The more high-quality info you feed the system—everything from website visits and email opens to past sales wins and losses—the smarter it gets. This is the big difference-maker: an AI strategy is always learning and adapting, while old-school, rules-based systems just sit there.

Machine Learning: The Virtual Sales Expert

At the very heart of AI lead generation is Machine Learning (ML). Picture a seasoned sales director who’s personally reviewed every single deal your company has ever closed. They have a gut feeling for the subtle signs that separate a future champion from a dead-end prospect. ML does the exact same thing, just at a scale and speed no human ever could.

It digs through your historical sales data to find the hidden patterns and common traits of your best customers. An ML model learns which combination of factors—like company size, industry, tech stack, and online behavior—are most likely to lead to a signed contract. This lets it assign a predictive score to every new lead, bumping the most promising ones right to the top of your sales team's list.

Here’s a quick look at how the old way stacks up against the ML-powered approach:

Lead Scoring AspectTraditional Method (Manual)Machine Learning Method (AI)Actionable Advantage
CriteriaRelies on simple demographics like job title or company size.Analyzes hundreds of behavioral and firmographic data points.Your scores reflect actual buying intent, not just a static profile.
AdaptabilityUses static rules that have to be updated by hand.Dynamically learns and adjusts scores as new data flows in.The system gets smarter over time without manual intervention.
AccuracyProne to human bias and subjective guesswork.Objectively prioritizes leads based on the statistical chance of conversion.Sales trusts the leads because they're backed by data, leading to higher follow-through.
OutcomeSales reps waste time chasing poorly qualified leads.Sales focuses its energy on high-potential leads, making everyone more efficient.Increased conversion rates and a shorter sales cycle.

Natural Language Processing: The 24/7 Receptionist

Next in the lineup is Natural Language Processing (NLP). This is the tech that fuels intelligent chatbots and understands text-based conversations. Think of an NLP-powered chatbot as a tireless, incredibly smart receptionist working on your website around the clock.

When a visitor asks a detailed question like, "Do your integration features work with our existing sales software, and what is the pricing for an enterprise team?" the bot doesn't just scan for keywords. NLP lets it understand the intent and context behind the words. It can answer the question directly, ask smart follow-up questions to qualify the visitor, and even book a demo with the right sales rep—all without a human lifting a finger.

Actionable Tip: Deploy an NLP chatbot on your pricing page. This is where visitors with high buying intent go. The bot can answer last-minute questions, offer a demo, and capture the lead before they navigate away.

Predictive Analytics: The Business Fortune Teller

Finally, there's Predictive Analytics, which acts like your company’s own fortune teller. While ML is busy scoring individual leads, predictive analytics is looking at the bigger picture. It crunches your historical data and current market trends to forecast future outcomes and spot opportunities you might otherwise miss.

For instance, it can identify which market segments are poised for growth or which types of accounts deliver the highest lifetime value. This allows you to proactively target entire companies or industries that fit the profile of your best customers, long before they even know you exist. The results speak for themselves; companies using AI have reported up to a 50% increase in lead generation and a 47% improvement in conversion rates. That kind of jump comes directly from shifting from a reactive to a predictive strategy, as detailed in the latest lead generation software market report.

When you understand how these systems use data to forecast behavior, you can put your marketing dollars and sales efforts exactly where they'll have the biggest impact. To go a bit deeper on this, check out our guide on how predictive analytics reshapes modern marketing.

Putting AI to Work in Your Sales Funnel

A visual representation of a sales funnel with AI icons at each stage, indicating how technology enhances the process.

It's one thing to talk about AI for lead gen in theory. It's another thing entirely to plug it into your sales funnel and see what it can actually do. The good news is, you don't have to rip and replace your entire process overnight.

Think of it as adding boosters at critical stages of the journey. AI’s job is to amplify what your team is already great at. It automates the soul-crushing repetitive work, spots the insights you might miss, and frees up your people to focus on closing deals. This is how you turn a leaky funnel into a high-pressure revenue engine.

Automating Lead Scoring and Prioritization

One of the quickest wins you can get with AI is in lead scoring. For years, this was a manual, rules-based guessing game. Sales teams would assign points based on static data like job title or company size, often chasing leads that looked good on paper but had zero intent to buy.

AI flips that script completely. Instead of relying on gut feelings, it analyzes hundreds of real-time behavioral signals—like someone binging three blog posts, revisiting the pricing page, and opening every email. It connects those dots to find the prospects who are actually ready for a conversation. This guarantees your team is always calling the hottest lead first.

The real shift is moving from a system that asks, "Who fits our ideal customer profile?" to one that answers, "Who is most likely to buy right now?" It's a small change in wording with a massive impact on your sales velocity.

To get this set up, check out our playbook on building an effective AI lead scoring system.

Engaging Prospects with Intelligent Chatbots

Your website is your digital storefront. But for most companies, it’s a passive experience where prospects have to fill out a "Contact Us" form and wait. An intelligent chatbot turns that passive site into a 24/7 lead qualification machine.

And I'm not talking about those clunky, rules-based bots that can't understand a typo. AI-powered chatbots use Natural Language Processing (NLP) to actually understand what your visitors are asking. They can answer tough questions, qualify leads on the spot, and even book a demo right into a sales rep's calendar.

Here's how that plays out:

  • Before AI: A hot prospect hits your pricing page at 10 PM. They have a question but have to submit a form. By the time your rep follows up the next morning, the prospect has already moved on.
  • After AI: That same prospect gets their question answered instantly by the chatbot. The bot sees they're from a target account, qualifies them, and books a meeting for the next day. The deal is already in motion.

This kind of immediate, helpful engagement is a game-changer for reducing drop-off. If you want to put this into practice, here's a great guide on building a chatbot specifically for lead generation that actually gets results.

Crafting Personalized Outreach at Scale

Everyone knows personalization works, but nobody has time to manually research every single prospect for a 1,000-person campaign. This is where AI really shines—it makes true one-to-one personalization possible at scale.

AI tools can scan a prospect's LinkedIn profile, company news, and recent online activity to find the perfect hook for an email. It’s way beyond just dropping in a {First_Name} token.

Actionable Tip: Use an AI writing assistant to generate three different opening lines for your next cold email sequence. Test them on a small batch of leads and see which one gets the highest reply rate. This simple A/B test can significantly lift campaign performance.

Imagine an AI crafting an email that mentions a recent funding round, a new product launch, or even a blog post your prospect just shared. That's the kind of message that cuts through the noise and gets a reply. It’s how you build real rapport from the very first touchpoint, without your team spending all day on research.

Choosing the Right AI Lead Generation Tools

Stepping into the world of AI lead generation tools can feel like walking into a massive electronics store. You know you need something, but the sheer number of options is dizzying. The key isn't to find the "best" tool, but the best tool for your specific needs, your tech stack, and your business goals.

The market isn't a monolith; it's a collection of specialized solutions. Getting a handle on the main categories is the first step to making a smart decision that actually delivers a return.

Understanding the Main Tool Categories

Not all AI tools are built to solve the same problem. Some are massive, comprehensive platforms designed to handle everything, while others are specialists that do one thing exceptionally well. Your choice comes down to the biggest gaps in your current process.

Here’s a breakdown of the four primary types of AI lead generation tools you’ll run into:

  • All-in-One CRM Platforms: Think of these as the Swiss Army knives of sales and marketing. Platforms like HubSpot and Salesforce have baked AI features directly into their core CRM, offering things like predictive lead scoring, automated workflows, and content personalization all under one roof. They’re perfect for teams that want a single source of truth and can't stand juggling disconnected systems.

  • Dedicated Lead Scoring Tools: These are the sharpshooters. Tools like MadKudu focus on one thing and do it better than anyone: analyzing your data to predict which leads are most likely to buy. They’re a great fit for companies that already have a good CRM but need a more powerful, data-science-driven engine to prioritize where sales should spend their time.

  • Conversational AI Chatbots: Platforms like Drift are built to engage your website visitors the second they land on your site. They act as your 24/7 digital sales reps, qualifying leads, answering basic questions, and booking meetings instantly. This category is a game-changer for businesses that get solid website traffic and want to convert more of those anonymous visitors into actual conversations.

  • Data Enrichment Platforms: Tools such as ZoomInfo use AI to find, verify, and flesh out contact and company data. Their whole job is to make sure your sales team has the most accurate and complete information possible before they ever pick up the phone. They are absolutely critical for teams running outbound prospecting and account-based marketing plays.

How to Select the Right Fit for Your Business

Choosing the right tool requires a clear-eyed look at your own organization. What works for a massive enterprise won't be the right fit for a nimble startup. Start by asking yourself a few fundamental questions about your biggest bottlenecks.

The image below from HubSpot shows how an all-in-one platform presents its AI features, often bundled into a cohesive suite.

This approach is all about having a unified system where AI enhances the workflows you already use, all within a familiar environment.

The most common mistake is buying a powerful tool to solve a problem you don't actually have. Before you even look at a feature list, map out your current sales process and pinpoint the exact stage where you're losing the most momentum.

Comparison of Lead Generation AI Tool Categories

To make this even clearer, let's put these tools side-by-side. This table breaks down the different categories to help you map your specific challenges to the right type of solution.

Tool CategoryPrimary FunctionIdeal ForExample ToolsKey Consideration
All-in-One CRM PlatformsUnify sales & marketing data with built-in AITeams wanting a single, integrated systemHubSpot AI, Salesforce EinsteinBest value if you use the entire platform, can be overkill otherwise.
Dedicated Lead ScoringPredict lead conversion likelihood with high accuracyCompanies with high lead volume needing prioritizationMadKudu, InferRequires clean, historical data to be effective. Focuses on "who," not "how."
Conversational AI ChatbotsEngage & qualify website visitors in real timeBusinesses with strong website trafficDrift, IntercomExcellent for inbound conversion, less so for outbound prospecting.
Data Enrichment PlatformsFind, verify, and complete contact & company dataOutbound-heavy sales teams & ABM strategiesZoomInfo, ClearbitSolves data accuracy but doesn't manage the outreach workflow itself.

This table should give you a solid framework for starting your search. The goal is to find a tool that slots directly into your biggest area of need, not one that forces you to change your entire process.

When you're evaluating your options, it's always a good idea to look at direct comparisons and check out alternatives to AI-powered lead generation platforms like Seamless.AI to get a feel for the market. This ensures you invest in tech that truly aligns with your team’s workflow and budget.

By starting with your problem, not the product, you make sure your investment actually drives growth.

Your Step-By-Step AI Implementation Plan

Bringing new tech into the mix can feel like a monster project, but if you break it down into a clear, actionable plan, it's totally manageable. Getting started with lead generation AI isn't about flipping a switch and hoping for the best. It's a methodical rollout—one that builds momentum and proves its worth every step of the way. This roadmap is designed to get you from planning to adoption, all based on a simple philosophy: start small, then scale.

Step 1: Set Clear and Measurable Goals

Before you even glance at a single tool, you need to define what a "win" actually looks like. Your goals are the anchor for your entire strategy. Without them, you risk buying a powerful platform that solves a problem you don't even have. Ditch the vague objectives like "improve lead generation" and get specific.

For instance, a solid goal is: "Reduce our average lead response time by 50% within the next quarter." It's specific, you can measure it, and it has a deadline. Another good one? "Increase the marketing qualified lead (MQL) to sales qualified lead (SQL) conversion rate by 15% in six months." Setting these kinds of benchmarks from the jump gives you a clear way to measure ROI down the road.

Step 2: Audit and Prepare Your Data

Here’s the hard truth: your AI is only as smart as the data you feed it. Think of it like a world-class chef—they can't whip up a gourmet meal with rotten ingredients. Before you do anything else, you have to conduct a serious audit of the data living in your CRM and other systems.

Start by asking the tough questions:

  • Is our data clean and standardized? Hunt down duplicates, incomplete records, and weird formatting.
  • Is our historical data accurate? The AI will be digging through past wins and losses to find patterns, so that information has to be trustworthy.
  • Do we have enough data? A machine learning model needs a decent volume of past lead and customer data to actually learn anything useful.

Data hygiene isn't a one-and-done task. It's an ongoing discipline. Getting standardized data entry protocols in place is non-negotiable for long-term AI success.

The most common reason AI initiatives fail isn't the technology itself—it's poor data quality. A clean dataset is the foundation upon which every successful AI strategy is built.

Step 3: Select and Integrate the Right Tools

Okay, goals are set and your data is in order. Now you can confidently start looking for a tool that lines up with your needs. As we’ve covered, the market is full of options, from all-in-one CRMs to specialized predictive scoring tools. Your choice should directly solve the main bottleneck you identified back in Step 1.

This visual lays out a simple path from planning to getting your tools integrated.

Infographic about lead generation ai

As you can see, setting goals and prepping your data are the essential first moves before you ever think about software.

Once you’ve picked your platform, integration is the next hurdle. A tool that doesn't talk to your existing CRM or marketing automation software is just going to create headaches. Prioritize solutions with solid, well-documented APIs and native integrations to make sure information flows smoothly across your entire tech stack.

Step 4: Train Your Team for High Adoption

A brilliant tool is completely useless if your team doesn't know how—or why—to use it. Good training isn't just about showing them which buttons to click. It’s about proving how this new lead generation AI will make their jobs easier and more successful.

Frame the training around their specific pain points. Show your sales reps how predictive lead scoring means fewer dead-end cold calls and more conversations with people who are actually ready to buy. For your marketers, demonstrate how AI-powered personalization can seriously boost campaign engagement. When your team sees how it directly benefits their own workflow (and their commission checks), adoption will follow.

Step 5: Start Small, Then Scale Your Strategy

Finally, fight the urge to roll out every single AI feature to the entire company at once. That's a recipe for disaster. Instead, kick things off with a single, high-impact pilot program. For example, implement an AI lead scoring model for just one sales team. Or launch an intelligent chatbot on one specific high-traffic page of your website.

This approach lets you iron out the kinks on a smaller scale, rack up some early wins, and build a powerful internal case study. Once you've proven the value and shown a clear ROI, you can use that success story to get broader buy-in and strategically scale your AI implementation to other teams and use cases.

How to Measure Your AI Lead Generation ROI

A digital dashboard with charts and graphs showing a positive return on investment, symbolizing successful AI implementation.

Throwing money at a new lead generation AI feels good, but justifying the spend requires hard numbers, not just a gut feeling. To get buy-in for next year's budget, you have to prove its worth. That means moving past vanity metrics and focusing on the KPIs that tie AI's work directly to revenue.

This is how you build an undeniable business case. Tracking the right numbers shows exactly how AI is making your entire sales process leaner, faster, and more profitable. It’s all about comparing the "before" and "after" to show a clear, positive hit to your bottom line.

Core KPIs for AI Impact

You don't need a hundred different charts. Start with a few critical metrics that tell a powerful story about how AI is improving lead quality and sales velocity.

  • Lead Conversion Rate: This is the big one—the percentage of leads that actually become customers. AI is supposed to find the needles in the haystack, so your sales team should be talking to more people who are ready to buy. A rising conversion rate is the clearest sign that it’s working.

  • Customer Acquisition Cost (CAC): How much does it cost to land a new customer? By automating grunt work and sharpening your targeting, AI cuts down on wasted time and ad spend. A lower CAC means every new customer is more profitable from day one.

  • Lead-to-Opportunity Ratio: This tracks how many leads are good enough to become a qualified sales opportunity. When AI handles the initial scoring and filtering, this number should climb. It’s proof that marketing is handing off better, more vetted prospects to the sales team.

Calculating Your Return

Now, let's tie it all together with a simple formula. The investment in this space is massive for a reason. The global AI market is already valued at around $391 billion as of 2025, with AI marketing alone on track to blow past $107 billion by 2028. You can get a better sense of the scale from these powerful AI market statistics.

The simplest ROI formula is: (Gain from Investment - Cost of Investment) / Cost of Investment. A positive result means your AI is officially paying for itself.

To make it real, think about the specific gains. Let's say your AI tool costs $20,000 a year but helps your team close an extra $100,000 in revenue because the lead scoring is so sharp. That's a huge win.

For a deeper dive into these numbers, our guide on how to calculate marketing ROI breaks down the entire framework. By keeping a close eye on these KPIs, you can prove that your lead generation AI isn't just another line item—it's a revenue engine.

Free Tool

Try our AI Lead Generator — find verified LinkedIn leads for any company instantly. No signup required.

Got Questions About AI in Lead Generation? We’ve Got Answers.

Jumping into an AI-driven strategy always sparks a few questions. It's a big shift. Let's tackle the most common ones head-on with some straight answers.

How Is This Really Different from What We Do Now?

AI takes the guesswork out of lead generation and replaces it with data-backed precision. Think about your traditional tactics—they often rely on static lists and broad-strokes campaigns. It's slow, a bit clunky, and you burn a lot of energy chasing leads that go nowhere.

AI flips that script. It’s always on, analyzing real-time buying signals to pinpoint leads who are actually showing intent. This means your sales team stops wasting time on cold trails and starts focusing their efforts on prospects who are genuinely ready to talk.

The real difference comes down to speed and intelligence. A traditional approach might take weeks to manually qualify a list of 1,000 leads. An AI system can score and prioritize that same list in minutes, collapsing your sales cycle.

Do I Need to Be a Tech Whiz to Use These Tools?

Absolutely not. Modern lead generation AI platforms are built for marketers and salespeople, not data scientists. Forget command lines and complex code—the best tools today are all about intuitive dashboards and guided workflows.

If you can use a CRM, you can use these tools. Most of the time, you’re just a few clicks away from setting up a sophisticated lead scoring model or launching a highly personalized campaign. All the heavy lifting—the hardcore data analysis and predictive modeling—is handled for you, humming away in the background.

Is This Actually Cost-Effective?

Yes, and the ROI becomes clearer the longer you use it. While there’s an initial investment, the real value shows up in a few key places:

  • Less Manual Grind: AI automates the repetitive, time-sucking tasks that bog down your team, freeing them up for high-value work.
  • Smarter Effort: By focusing your team only on the best-fit leads, conversion rates naturally go up. You start generating more revenue from the same pool of prospects.
  • Lower Acquisition Costs: When you stop spraying and praying with your ad spend and outreach, your Customer Acquisition Cost (CAC) drops significantly.

Ultimately, AI lets you scale your growth without having to scale your headcount at the same rate. That makes it one of the smartest long-term investments you can make for your pipeline.


Ready to see how an integrated AI platform can transform your entire marketing and sales funnel? marketbetter.ai unifies content creation, campaign optimization, and customer engagement to deliver measurable results. Get a demo today and discover your path to smarter growth.

Inbound Lead Generation: 7 Channels Ranked by Cost-Per-Lead (With Real Numbers) [2026]

· 26 min read

Inbound lead generation isn't about chasing customers. It's about drawing them in.

Think of it as earning attention instead of renting it. In a world saturated with interruptive ads and cold calls, an inbound lead generation strategy focuses on creating genuinely helpful content and experiences that solve your ideal customers' problems. This approach builds trust from the very first interaction, turning strangers into interested prospects and laying the foundation for a sustainable growth engine.

The Magnetic Approach to Attracting Customers

Let's be honest, old-school marketing often feels like shouting into a void. You blast out a generic message and just hope someone, somewhere, is listening. This is the core of outbound: pushing a message out.

Inbound is the polar opposite. It’s a powerful magnet. It pulls in the right people—the ones who are already out there actively searching for the exact solutions you offer. Instead of shoving a sales pitch in their face, you're offering up a helping hand, a useful piece of advice, a solution. You build a relationship first.

This shift completely changes the customer's journey. They find you on their own terms, which makes them far more receptive to what you have to say. It’s a trust-based approach that doesn’t just get you a lead; it creates a loyal customer who might just become your biggest fan.

The Three Stages of the Inbound Flywheel

The whole inbound methodology is powered by a simple, continuous cycle with three stages. Each part is designed to build on the last, creating momentum and a seamless experience that keeps people coming back.

  • Attract: This is all about pulling in the right crowd. You’re not trying to get just any traffic; you want the people who are a perfect fit for your business. Your action item: Start by building a content plan around the problems your ideal customers are trying to solve. Use tools like AnswerThePublic or Google's "People also ask" feature to find the exact questions they're typing into search engines. This is the foundation for valuable blog posts, social media updates, and smart SEO strategies.

  • Engage: Okay, you've got their attention. Now what? The goal here is to offer solutions that line up perfectly with their needs and goals. This is where you might offer a compelling ebook, a deep-dive webinar, or a helpful template in exchange for their contact info. It's the start of a real conversation. Your action item: For every "Attract" stage blog post you create, design a corresponding "Engage" stage asset. For a post on "10 Social Media Tips," offer a downloadable "Social Media Content Calendar Template."

  • Delight: The job isn't done once they become a customer. This final stage is about delivering such an incredible experience that they can't help but tell others about you. Your action item: Set up an automated check-in email 30 days post-purchase asking for feedback or offering advanced tips. This simple action turns a transaction into a relationship and fuels positive reviews.

This chart gives you a real-world look at how this plays out, showing what can happen with an initial 10,000 website visitors as they move through the funnel.

Infographic about inbound lead generation

As you can see, people naturally drop off at each stage. That's totally normal. But it also shows just how critical it is to nail every single interaction, turning more of those initial visitors into leads, and eventually, into your most passionate brand advocates.

Choosing Your Approach: Inbound vs. Outbound

Two arrows pointing in opposite directions representing the different approaches of inbound and outbound lead generation

When you're trying to fill your pipeline, every dollar counts. Getting a handle on the core difference between inbound and outbound lead generation is the first step to spending your budget wisely.

Think of it this way: inbound is a magnet, and outbound is a megaphone.

Inbound marketing acts like a magnet, pulling in prospects who are already out there looking for answers you can provide. Outbound marketing is the megaphone, blasting your message out to a broad audience, hoping to catch the attention of a few.

Both can work, sure. But their methods, costs, and the kind of value they create over time couldn't be more different. An outbound strategy is all about initiating contact—think cold calls, email blasts, or paid ads that interrupt someone's day. It's designed for immediate, if sometimes unpredictable, results.

On the other hand, an effective inbound lead generation strategy is about building valuable assets. We're talking about blog posts, in-depth guides, and webinars that organically attract people who have a problem you can solve. This approach isn't just about getting a lead; it's about building trust and positioning yourself as the go-to expert.

Evaluating Key Business Factors

So, where do you put your money? It really comes down to the quality and longevity you're after.

Outbound campaigns, especially things like paid ads, have a simple on/off switch. The second you stop pumping money into them, the leads dry up. You're essentially renting attention.

Inbound marketing is different. It's about building assets that pay dividends for years. A single, high-ranking blog post can keep attracting qualified leads month after month, long after you hit publish. This is why content marketing consistently delivers three times more leads than traditional marketing, and at a much lower cost. It's an investment that compounds.

The real split is between permission and intent. Inbound leads come to you—they’ve raised their hands by downloading your guide or reading your blog. Outbound often means showing up uninvited, forcing you to convince someone they have a problem in the first place.

This distinction has a massive impact on lead quality. Inbound leads have already done their homework. They've found you. They're naturally warmer and more educated, which almost always leads to shorter sales cycles and better conversion rates than you'll see from a cold outbound list.

A Strategic Comparison of Inbound vs. Outbound Lead Generation

To really nail down which approach (or what mix) is right for you, it helps to see them side-by-side. This table breaks down the core differences between inbound and outbound marketing across key business metrics to inform your strategic planning.

MetricInbound Lead Generation (The Magnet)Outbound Lead Generation (The Megaphone)
ApproachAttracts interested prospects by providing valuable content and solutions. The buyer initiates contact.Proactively reaches out to a broad audience, often interrupting their day. The company initiates contact.
Lead QualityLeads are generally higher-quality and more qualified as they have self-identified a need.Leads are often colder and require significant nurturing and qualification to determine interest.
Cost-EffectivenessTends to be more cost-effective over time, with a lower cost per lead as content assets mature.Can be expensive, with costs directly tied to campaign activity (e.g., ad spend, call volume).
Long-Term ValueCreates sustainable, long-lasting marketing assets (SEO, content) that generate leads continuously.Provides short-term results that typically stop when the campaign ends. It doesn't build lasting assets.
ScalabilityHighly scalable. A single piece of content can serve thousands of prospects without increased effort.Can be resource-intensive to scale, often requiring more budget or a larger sales team to expand reach.
Buyer ControlEmpowers the buyer, allowing them to research and engage on their own terms, building trust.The seller is in control of the interaction, which can sometimes feel intrusive or pushy to the buyer.

Ultimately, a strong marketing engine often uses a blend of both. But understanding where each one shines helps you build a smarter, more sustainable plan for growth.

The Three Pillars of an Inbound Strategy

Three interlocking gears representing SEO, Content, and Social Media as the pillars of an inbound strategy

A powerful inbound lead generation engine isn’t something you just switch on. It’s built on three core pillars that have to work in lockstep: Search Engine Optimization (SEO), Content Marketing, and Social Media Engagement.

Think of it like a three-legged stool. If one leg is shaky or missing entirely, the whole thing topples over. To build a system that reliably pulls in qualified leads, you need to understand how these three elements feed and amplify each other.

Pillar 1: Search Engine Optimization

SEO is what makes you discoverable. It’s the foundation. Without it, the most brilliant content on earth is just shouting into the void. The mission is simple: when your ideal customer types a problem into Google, you need to be one of the first solutions they see.

This work starts way before you write a single headline. The first step is to perform effective keyword research. This isn't just about chasing high-volume terms; it's about getting inside your audience's head to understand the exact questions, pain points, and phrases they use.

For instance, a keyword like "marketing software" is a battleground. But a more specific, high-intent phrase like "AI-powered content creation for B2B tech" is much more likely to attract someone who has a real, immediate need.

Actionable On-Page SEO Checklist

Once you know what terms you're targeting, you have to optimize your content. Here’s a quick checklist to run through for every piece you publish:

  • Title Tag: Get your main keyword in there, preferably near the start. But make it sound human—it needs to earn the click.
  • Meta Description: This doesn't directly impact rankings, but it's your sales pitch in the search results. Write it to persuade someone to choose your link over the nine others on the page.
  • Headings (H1, H2, H3): Use your primary keyword in the main H1 heading. Sprinkle variations throughout your subheadings (H2s, H3s) to give the page a logical structure for both people and search engines.
  • Internal Linking: Weave in links to other relevant blog posts and service pages on your site. This shows search engines how your content is connected and keeps visitors on your site longer.

Pillar 2: Content Marketing

If SEO is the foundation, content is the actual house you build on it. This is where you deliver real value that turns a random visitor into a genuine lead. Here’s the secret to inbound lead generation: great content isn't about selling your product; it's about solving your audience's problems.

The trick is to create different assets for different stages of their journey. A prospect who is just starting to realize they have a problem needs something very different from someone who's already comparing vendors. This is where knowing your audience becomes non-negotiable. To nail this, you have to master identifying and understanding your audience segments. Our guide on customer segmentation strategies is a great place to start.

Creating valuable content isn’t a one-off task; it’s a commitment to becoming the most trusted resource in your industry. When you consistently answer your audience’s questions, they stop seeing you as a vendor and start seeing you as a partner.

Your content library needs variety. Blog posts are fantastic for pulling in top-of-funnel traffic, but you need meatier assets to actually capture leads. Action item: Map your existing content to the buyer's journey (Awareness, Consideration, Decision). You'll likely find you have plenty of "Awareness" content (blogs) but are thin on "Consideration" (comparison guides) or "Decision" (case studies). This gap analysis instantly builds your next content calendar.

  • Ebooks and Whitepapers: These offer a deep dive into a specific topic and are perfect for gating behind an email sign-up form.
  • Webinars: A live, interactive training session establishes your authority like nothing else and lets you engage directly with potential customers.
  • Templates and Checklists: Give away practical, hands-on tools that solve an immediate problem for your audience. They're incredibly effective lead magnets.

Pillar 3: Social Media Engagement

Social media is the megaphone for your content and the handshake for your brand. And for B2B companies, one platform consistently punches above its weight for inbound leads: LinkedIn.

This is where you graduate from just dropping links. It’s about building authority, joining real industry conversations, and funneling highly relevant traffic back to your website. Unlike other platforms built for entertainment, LinkedIn is where professionals and decision-makers go looking for solutions.

The numbers don't lie. Content marketing can generate three times more leads than old-school marketing, and it does so at up to 62% less cost. Pair that with LinkedIn, where 89% of B2B marketers go to generate leads, and you've got a powerhouse combination. In fact, LinkedIn's own Lead Gen Forms boast an average conversion rate of 13%—more than five times higher than what you'd typically see on a landing page.

Here’s how to put it into action:

  1. Share Content with Context: Never just post a link and walk away. Pull out a juicy quote, a surprising stat, or a challenging question to kickstart a conversation.
  2. Engage in Relevant Groups: Find the LinkedIn Groups where your ideal customers hang out. Answer questions and offer real insights, but don't be spammy.
  3. Activate Your Team: Encourage your sales and leadership teams to share company content and build their own professional brands. A post from a person will almost always get more reach than a post from a company page.

Your Essential Inbound Lead Generation Toolkit

A digital illustration showing a toolbox filled with software logos representing CRM, SEO, and marketing automation tools.

Trying to run a modern inbound strategy without the right tech is like trying to build a house with only a hammer. You might get a few boards nailed together, but you’re not building anything that will last. If you want to scale your efforts, manage relationships effectively, and actually prove your ROI, you need to stock your toolbox.

Building the perfect tech stack isn’t about grabbing the most expensive software off the shelf. It’s about picking tools that actually talk to each other, automate the grunt work, and give you clear insights. For any serious B2B team, there are three non-negotiables: a CRM, SEO tools, and Marketing Automation software.

Choosing Your Core CRM Platform

Think of your CRM as the central nervous system for your entire inbound machine. It’s the single source of truth where every bit of lead data lives—from their first anonymous website visit to their most recent call with sales. Getting this decision right is foundational; it impacts everyone.

HubSpot vs. Salesforce: A Quick Comparison

FeatureHubSpotSalesforce (Marketing Cloud)
Core StrengthAn all-in-one platform built from the ground up for inbound marketers. It just works.An incredibly powerful and customizable platform built for complex, large-scale enterprises.
Best ForSMBs and mid-market companies that need a single, unified solution for marketing, sales, and service.Large enterprises with dedicated admin teams who need deep customization and complex integrations.
Learning CurveLow. The interface is intuitive, so teams can get up and running fast without tons of training.High. You often need a certified administrator just to set it up and manage it properly.

For most teams just dipping their toes into inbound lead generation, HubSpot is usually the path of least resistance. Its real power is how seamlessly everything is integrated. The marketing, sales, and service hubs feel like one cohesive system because they were built that way. Salesforce is a beast, but it can often feel like you’re duct-taping different systems together, which takes a lot more technical know-how.

Mastering Visibility with SEO Tools

You can pour your heart into creating the best content in your industry, but if no one can find it, it might as well not exist. SEO tools are your eyes and ears on the ground. They show you what your audience is actually searching for, how your competitors are ranking, and where your biggest opportunities are hiding.

The two heavyweights in this arena are Ahrefs and SEMrush. They both cover the basics—keyword research, backlink analysis, site audits—but they each have their own personality.

  • Ahrefs: This is the gold standard for backlink data. If your strategy is heavily focused on building links and reverse-engineering your competitors' link profiles, Ahrefs gives you an undisputed advantage. It's a specialist's tool.
  • SEMrush: This platform is more of a comprehensive digital marketing suite. It has powerful features that go beyond SEO, covering PPC, content marketing, and social media analytics. It’s a great pick if you want an all-in-one platform to manage your online visibility.

Your choice really comes down to focus. Are you a link-building purist? Go with Ahrefs. Do you need a versatile toolkit that covers the whole marketing landscape? SEMrush is your powerful generalist.

Scaling Engagement with Marketing Automation

If your CRM is the nervous system, marketing automation is the engine that drives everything forward. This is the software that lets you deliver the right message to the right person at the right time, turning lukewarm leads into sales-ready prospects without you having to lift a finger for every email.

It's no surprise the demand for this tech is exploding. The lead generation solutions market in North America was valued at over US$1.22 billion in 2021 and is projected to hit US$3.62 billion by 2028. This growth is being driven by AI-powered lead scoring and automation that makes the whole process more efficient. You can see more on the growth of lead generation technology on growthlist.co.

Automation isn't about replacing the human touch. It's about saving it for the moments that truly matter. It handles the repetitive follow-ups so your team can focus on building real relationships with your most engaged leads.

This is where AI is really starting to shine, especially with intelligent lead scoring. By crunching thousands of data points, these platforms can predict which leads are most likely to buy, helping your sales team focus their energy where it counts. To go deeper, check out our guide on how predictive analytics in marketing is changing the game.

Tools like Marketo or Pardot (now Marketing Cloud Account Engagement) are leaders here, giving you the power to build complex nurturing workflows and align tightly with sales for a seamless handoff.

Measuring Your Inbound Marketing Success

Running an inbound strategy is one thing. Proving it actually works? That’s a whole different ballgame.

To show the real value of all that content, SEO, and social media effort, you have to look past the easy-to-find vanity metrics. Things like social media likes or raw website traffic feel good, but they don't pay the bills. The real focus needs to be on Key Performance Indicators (KPIs) that tie directly to business growth.

Think of it like this: website traffic is just the number of people window-shopping at your store. It’s nice to have a crowd, but it doesn’t tell you who’s actually ready to buy. True measurement for inbound lead generation hones in on the actions that turn those window shoppers into paying customers.

To really nail this, you have to learn how to measure SEO success beyond rankings. It’s a critical shift in mindset that moves the conversation from "Are we visible?" to "Are we profitable?"

Key Metrics That Actually Matter

To get a clear picture of your inbound ROI, you need a dashboard that tracks the right stuff. Forget the noise and start with these three core metrics. Together, they tell the full story, from a prospect's first click to the final sale.

  • Lead Conversion Rate: This is your gut check. It’s the percentage of visitors who take the action you want them to, like filling out a form for an ebook. It tells you flat-out if your content and landing pages are hitting the mark. A low rate? Your offer might be weak, or your form is a pain to fill out.

  • Cost Per Lead (CPL): This one is simple but powerful. It’s how much you’re spending to get one new lead. Just divide your total marketing spend by the number of new leads you generated in that period. This is how you spot which channels are efficient and which ones are just eating your budget.

  • Customer Acquisition Cost (CAC): Here it is—the metric that matters most to your CFO. CAC measures the total cost of winning a new customer, blending all your marketing and sales expenses. For a business to be healthy, your CAC has to be way lower than the lifetime value (LTV) of a customer. No exceptions.

From Metrics to Business Impact

Tracking these numbers is just step one. The real magic happens when you connect them to actual revenue, and that’s where a good CRM is non-negotiable.

There’s a reason 67.8% of marketers use a CRM to store and track their leads. They’re trying to close the gap. While 91% of marketers say lead generation is their top priority, a sobering 80% of those new leads never become customers. That’s a massive disconnect between effort and results.

Let's look at two common scenarios that show why connecting the dots is so important:

ScenarioMarketing's FocusThe ProblemThe Fix
Scenario ADriving huge traffic numbers to the blog.Traffic is high, but no one's converting. The sales team complains the leads are junk.Stop chasing traffic. Focus on Lead Conversion Rate. Go back to your top-performing posts and add stronger calls-to-action and better lead magnets.
Scenario BGenerating a high volume of leads.The lead count is up, but the Customer Acquisition Cost is through the roof. Deals are taking forever to close.Stop treating all leads equally. Use lead scoring to flag the ones ready to talk and use nurturing workflows to warm up the rest.

When you analyze these metrics together, you can diagnose what's broken and make decisions based on data, not guesswork. If your CPL is low but your CAC is high, that’s a red flag waving over the handoff between your marketing and sales teams.

For a deeper dive into setting up these tracking systems, our guide on essential lead generation key performance indicators has you covered. This is how you turn your marketing from a cost center into a predictable revenue engine.

How to Build Your Inbound Lead Generation Plan

Alright, let's get practical. Moving from inbound theory to an actual, documented plan is where the magic happens. A killer inbound lead generation strategy isn't something you stumble into; it’s built, piece by piece, with a clear framework. This is the process that turns your big-picture goals into daily tasks your team can actually run with.

Think of your plan as the architectural blueprint for your marketing engine. Without one, you're just bolting random parts together and hoping for the best. A solid plan ensures every blog post, every keyword, and every email serves a purpose.

Start with Your Ideal Customer Profile

Before you write a single headline, you have to know exactly who you're talking to. Your Ideal Customer Profile (ICP) is more than a vague persona—it’s a razor-sharp portrait of the perfect-fit customer for your business. This is your north star.

To make an ICP that actually works, you have to go deeper than the usual demographics. Dig into the real-world details that define a high-value account for your company.

  • Firmographics: What's the sweet spot for company size, industry, and annual revenue? Are they all in a specific region?
  • Technographics: What’s in their tech stack right now? Are they using tools that compete with yours, or ones that complement it?
  • Pain Points: This is the big one. What specific, nagging business problems are they dealing with that your product was built to solve?

An unfocused plan tries to be everything to everyone and ends up being nothing to anyone. A sharp ICP ensures your resources are aimed at prospects who are most likely to convert, stay, and grow.

The most common mistake I see is an ICP that’s way too broad. "Mid-sized tech companies" is a starting point, not a target. Contrast that with something like: "B2B SaaS companies in North America with 50-200 employees, using Salesforce, who are struggling with slow, inconsistent content creation." Now that gives your team a clear target to aim for.

Audit and Map Your Content

With your ICP locked in, it's time to take stock of your content arsenal. A content audit isn't about judging what you've done in the past. It's a strategic look at what you already have, what you can repurpose, and where the glaring holes are. The whole point is to map every piece of content to a specific stage of the buyer's journey.

Actionable Content Mapping Checklist:

  1. Inventory Your Assets: Get a spreadsheet going and list everything you've got—blog posts, whitepapers, case studies, webinars, the works.
  2. Align with Buyer Stages: Tag each piece of content with its corresponding buyer stage: Awareness, Consideration, or Decision. Does that blog post answer a high-level question? Or does that case study help someone compare their options?
  3. Find the Gaps: Now, where are the holes? It's common to find you're flush with awareness-stage blog posts but have almost nothing for the consideration stage, like comparison guides or ROI calculators. This is your new to-do list.
  4. Build a Content Calendar: Map out your content creation for the next quarter. Assign topics, formats, and due dates to fill the gaps you just found. This ensures you’re consistently publishing valuable stuff for your ICP, no matter where they are in their journey.

Design Your Lead Nurturing Workflow

So, a prospect just downloaded your ebook. Great! But the journey has just begun. A lead nurturing workflow is your automated system for guiding them from that initial interest toward a real sales conversation. This is where your marketing automation platform really earns its keep.

Your workflow needs to feel like a conversation, not a sales pitch. Instead of just spamming them with product features, deliver more value that builds on why they came to you in the first place. For instance, if someone downloaded an ebook on "SEO Basics," your nurture sequence could follow up with an invite to a webinar on "Advanced Link Building," and then maybe offer a free "Content Audit Template."

This step-by-step approach builds trust and quietly qualifies leads over time. By the time that person gets handed off to sales, they're not cold—they're educated, engaged, and ready for a much more productive chat. And that, right there, is how you dramatically improve your conversion rates.

Free Tool

Try our AI Lead Generator — find verified LinkedIn leads for any company instantly. No signup required.

Got Questions? We've Got Answers.

Switching to an inbound strategy always kicks up a few big questions. That's a good thing. Getting clear on the timeline, budget, and team dynamics upfront is the difference between a program that flies and one that fizzles out. Let's tackle the questions that come up most often when B2B teams start this journey.

How Long Until This Inbound Thing Actually Works?

This is always the first question, and the answer requires a total mindset shift. You're not flipping a switch on a paid ad; you're planting an orchard.

You can expect to see the first green shoots—some initial traction—within 3-6 months. But for a predictable, steady harvest of leads, you’re looking at the 6-12 month mark. Why so long? The first few months are all foundational work: deep keyword research, publishing your first pillar pages and blog posts, and getting your lead capture forms dialed in.

Think of it like this: Outbound is a sugar rush. It gives you a quick spike, but it's gone the second you stop spending. Inbound is building a lead-generating asset that works for you 24/7, compounding its value month after month, long after you hit "publish."

How Do We Even Budget for This?

Budgeting for inbound isn't like buying media. You're investing in assets, not ad space. The two biggest line items are almost always talent and technology.

  • Content Creation: This is the fuel for your entire engine and your biggest variable. Are you using in-house experts? Hiring freelance writers? Partnering with an agency? Don't skimp here. Top-tier, genuinely helpful content is non-negotiable.
  • Technology Stack: You'll need a solid CRM and marketing automation platform (like HubSpot), an SEO tool for insights (like Ahrefs or SEMrush), and maybe a few other tools for design or video.
  • Team Resources: You need real people to steer the ship—to manage the strategy, create the content, analyze what's working, and talk to people on social media.

The classic mistake is buying a Ferrari of a tech stack and then trying to run it on lawnmower gas. A powerful platform is useless without high-quality content to feed it.

How Do We Get Marketing and Sales to Actually Work Together?

This is where the rubber meets the road. If marketing is high-fiving over 1,000 new leads but sales is complaining they're all junk, your program is dead on arrival.

The single most powerful thing you can do is lock both teams in a room until they hammer out a Service Level Agreement (SLA).

This isn't just another corporate document. It’s a peace treaty. It forces everyone to agree on a crystal-clear definition of a "qualified lead" and dictates exactly how and when sales will follow up. It replaces finger-pointing with a shared playbook and is the absolute bedrock of any inbound program that actually drives revenue.


Ready to stop chasing leads and start attracting them? marketbetter.ai uses an integrated AI approach to accelerate content creation and scale your inbound efforts. Discover how our platform can help you build a predictable revenue engine by visiting https://www.marketbetter.ai.

How to Calculate Marketing ROI: 5 Copy-Paste Formulas With Worked Examples [2026]

· 19 min read

Your CFO doesn't care about impressions, followers, or "brand awareness." They want one number: for every dollar spent on marketing, how many dollars came back?

That's marketing ROI — and 73% of teams get it wrong. They either give all credit to the last click (ignoring the 6-month nurture that warmed the deal), or they leave out real costs like tools, headcount, and agency fees.

This guide gives you 5 copy-paste formulas for calculating marketing ROI at the campaign, channel, and program level — each with a fully worked example. No theory. No fluff. Just the math your CFO will accept.

The Foundational Marketing ROI Formula

A calculator and a pen lying on a financial document, symbolizing the calculation of marketing ROI.

Before you get lost in complex attribution models and channel-specific metrics, you have to master this one formula. Think of it as your financial North Star. It keeps your strategy grounded in business reality and translates all your hard work into a language the C-suite and finance teams actually understand.

Getting this right isn't just about crunching numbers; it's about proving your department's value. Once you can confidently show how campaigns contribute to the bottom line, budget conversations stop being defensive and start being strategic.

Let's start with the foundational formula, then work through each variation.

A Practical Example of the Formula

Let's put it into practice. Imagine you launched a new campaign with a total investment of $150,000. After a few months, you can directly attribute $500,000 in new revenue back to it.

Here's the math: ($500,000 - $150,000) / $150,000 = 2.33

Your ROI is 233%.

This means for every dollar you put in, you got back $2.33 in return. A simple number like this is incredibly powerful. It gives you a clear, objective measure of success and lets you compare apples to apples. Now you can easily see if your new social media campaign is outperforming last quarter's email push.

Actionable Takeaway: Mastering the basic ROI formula is the first step toward data-driven marketing. It transforms your performance from a matter of opinion into a statement of financial fact, enabling smarter budget allocation and strategic planning. Start by applying this formula to your single biggest campaign from the last quarter.

Breaking Down the Components

To get a reliable ROI figure, you have to be crystal clear about what goes into each part of the formula. If your inputs are fuzzy, your output will be useless. This isn't just about ad spend versus revenue; it's about capturing the true cost and the attributable gain.

Here's a quick comparison of what to include in each part of the basic ROI formula.

ComponentWhat It IsCommon Mistakes to Avoid
Revenue from MarketingThe total sales revenue that is directly tied to a specific marketing campaign or effort.Relying on guesswork. Without accurate tracking-like UTM codes or dedicated landing pages-you're just guessing how much money you actually made.
Marketing CostThis includes every single expense related to the campaign. Think beyond just ad spend.Forgetting "soft" costs. To get a true picture, you must include software fees, content creation costs, agency retainers, and even a portion of your team's salaries.

Defining these terms upfront is non-negotiable. Ambiguity is the enemy of accurate ROI calculation, and getting this part right ensures your final number truly reflects your campaign's financial impact.

Gathering Accurate Data for Your Calculation

Your marketing ROI calculation is only as good as the numbers you feed it. Garbage in, garbage out. If the data is shaky, you'll get a misleading result, which can lead to disastrous decisions like cutting your best-performing campaigns or doubling down on ones that are secretly bleeding cash.

The first step is getting ruthlessly honest about what you're actually spending. This is about more than just your direct ad spend. To get the true picture of your investment, you have to account for everything that supports your marketing.

Think of it like building the complete financial story of a campaign. You need to include:

  • Software and Tools: The subscription fees for your CRM, marketing automation, analytics platforms, and any design software you use.
  • Creative and Production: All the money paid to freelancers, agencies, or contractors for things like content creation, video production, or ad creative.
  • Team Costs: A portion of your marketing team's salaries, calculated based on the time they spent on that specific campaign.

Connecting the Dots Between Effort and Revenue

Once you have a firm handle on your costs, the next-and often trickier-part is tying revenue back to the right marketing activities. This is where so many marketers trip up.

How do you really know if that latest sale came from a social media ad, a blog post they read last month, or an email you sent yesterday? The answer is in how you assign credit, a process known as attribution modeling. It's a framework for assigning value to the different touchpoints a customer has with you before they finally buy.

A Quick Look at Common Attribution Models

Choosing the right attribution model is a big deal because each one can tell a completely different story about which channels are working. Single-touch models are simple but often paint an incomplete picture, while multi-touch models give you a more realistic view of the modern, messy customer journey.

Here's a comparison of the most common models:

Attribution ModelHow it WorksBest ForPotential Blind Spot
First-TouchGives 100% credit to the very first interaction.Understanding which channels are best at generating initial awareness.Ignores every subsequent touchpoint that nurtured the lead.
Last-TouchGives 100% credit to the final touchpoint before conversion.Identifying your most effective "closer" channels.Overlooks all the top- and mid-funnel activities that made the sale possible.
Linear (Multi-Touch)Spreads credit equally across every touchpoint.A balanced view that acknowledges the entire customer journey.Fails to identify which touchpoints were the most influential.

Actionable Takeaway: For most businesses, especially those with a longer sales cycle, a multi-touch model is the way to go. It prevents you from mistakenly axing top-of-funnel activities (like content or social media) that don't directly drive sales but are absolutely critical for filling your pipeline. If you're currently using a last-touch model, try switching to a linear view in your analytics platform to see how it changes your perception of channel performance.

Today's customer journey is messy and rarely linear. Relying on a single data point can warp your entire strategy. The better you get at connecting these dots, the smarter your decisions will be. This is where more advanced techniques, like using person-level identification, can give you a much deeper understanding of how individual people engage with your brand across all their devices and interactions.

Moving from Revenue to Profit-Based ROI

Looking at revenue-based ROI is a decent first step, but it can easily paint a deceptively rosy picture. I've seen it happen plenty of times: a campaign generates a ton of revenue and gets high-fives all around, but when you look closer, it was actually losing money because the costs of delivering the product were too high.

To get a truly honest view of your marketing's financial impact, you have to shift your focus from top-line revenue to bottom-line profit.

This is where Cost of Goods Sold (COGS) enters the conversation. COGS includes all the direct costs tied to creating your product or service-think raw materials, manufacturing labor, and shipping. When you subtract COGS from your revenue, you get your gross profit. That number is a much more accurate measure of what a campaign actually contributed to the business.

The Profit-Based Formula

Calculating your marketing ROI using gross profit gives you a brutally honest look at a campaign's real performance. The go-to formula is simple:

Marketing ROI = (Gross Profit - Marketing Investment) / Marketing Investment

Let's say a campaign brings in $80,000 in revenue. But the COGS associated with those sales was $40,000. That leaves you with a gross profit of $40,000. If you spent $10,000 on marketing, the math becomes ($40,000 - $10,000) / $10,000. The result? A 300% ROI. This is a profitability metric you can take to the bank, and you can dig deeper into its applications in this great analysis of marketing ROI on sprinklr.com.

For any business with tangible product costs-like e-commerce brands or manufacturers-this profit-centric approach isn't just a good idea; it's non-negotiable. It's how you ensure you're driving sustainable growth, not just celebrating vanity revenue.

The infographic below shows just how drastically the ROI figure can change when you swap from revenue to profit for the exact same campaign.

Infographic comparing Revenue-based ROI at 150% and Profit-based ROI at 50% to show the importance of profit in calculating marketing ROI.

As you can see, a campaign that looks like a winner on the surface can turn out to be far less impressive once you account for the real costs of doing business.

Revenue vs. Profit: A Real-World Comparison

Let's make this tangible. Imagine an e-commerce company launches a paid ad campaign for a new line of sneakers.

  • Marketing Investment: $20,000
  • Revenue Generated: $50,000
  • Cost of Goods Sold (COGS): $30,000 (for materials, manufacturing, etc.)

Now, let's run the numbers using both methods.

MetricCalculationResultInterpretation
Revenue-Based ROI($50,000 - $20,000) / $20,000150%Looks great! The campaign generated $1.50 for every $1 spent.
Profit-Based ROI($20,000* - $20,000) / $20,0000%Oof. The campaign broke even. It didn't lose money, but it sure didn't make any.
*Gross Profit = $50,000 Revenue - $30,000 COGS

This comparison slams home a critical truth: revenue tells you what you brought in, but profit tells you what you kept. Relying only on revenue ROI could trick you into scaling a campaign that is, in reality, just treading water.

Making this small but powerful adjustment to how you calculate ROI gives you the clarity to pour your budget into campaigns that don't just generate noise, but genuinely build a healthier, more profitable business. It's the difference between looking busy and being effective.

Calculating ROI Across Different Marketing Channels

A multi-channel marketing dashboard on a screen, showing performance metrics for different channels like social media, email, and search ads.

Trying to apply one ROI formula to every marketing channel is a rookie mistake. It's like using a hammer for every job on a construction site-sure, you can bang a screw into the wall, but it's not the right tool and the results will be a mess.

Your marketing mix is (or should be) diverse. Each channel plays a different part. Because of that, your ROI calculation has to adapt to the unique nature of each one. Some channels deliver quick, trackable wins. Others are a slow burn, building value that compounds over months or even years. Getting this right is the key to setting sane expectations and putting your budget where it actually works.

The Great Divide: Short-Term vs. Long-Term Channels

The biggest split you'll see when calculating ROI is the timeline. You can't judge a six-month SEO project with the same yardstick you use for a two-week Google Ads campaign. One is a sprint; the other is a marathon.

  • Paid Digital Ads (Google & Meta): These channels are built for direct response. You can tie ad spend directly to clicks, leads, and sales, often within days. The data is clean, attribution is relatively straightforward, and you can calculate ROI fast enough to make smart decisions on the fly.

  • Content Marketing & SEO: This is about building an asset. A blog post you publish today might not generate a single lead for months. But over time, it could climb the ranks and drive organic traffic-and customers-for years to come. Calculating ROI here demands a longer view and a focus on metrics like traffic growth, keyword rankings, and assisted conversions.

Comparing ROI Calculation Across Marketing Channels

Let's get practical. How you approach calculating ROI for these two channel types is fundamentally different. The table below breaks down the key metrics, primary challenges, and the kind of timeline you should expect for each. It's all about measuring what matters for that specific strategy, not forcing everything into the same box.

ChannelKey MetricsPrimary ChallengeTypical Time-to-Value
Paid Digital AdsCost Per Acquisition (CPA), Return on Ad Spend (ROAS), Conversion RateRising ad costs and ad fatigue can crater your returns. Requires constant monitoring and optimization.Immediate (Days to Weeks)
Content & SEOOrganic Traffic, Keyword Rankings, Assisted Conversions, Customer Lifetime Value (CLV)Attributing revenue is tough. Content influences dozens of touchpoints over a long buyer journey.Long-Term (Months to Years)

This comparison makes it pretty clear: you need a blended approach. Paid ads give you the quick wins and immediate data you need to fuel growth now. Content and SEO build the sustainable, long-term engine that eventually lowers your dependency on paid channels.

For example, a paid search campaign might show an immediate 250% ROI in its first month. Awesome. Meanwhile, a content marketing initiative could look like a total loss for the first six months. But by year two, that same content might be driving thousands in monthly revenue with zero additional spend, pushing its long-term ROI far beyond what the paid campaign could ever achieve.

Understanding this dynamic stops you from killing long-term strategies before they've had a chance to bear fruit. A healthy marketing ecosystem needs both.

Even better, you can make them work together. Use insights from your paid campaigns to sharpen your SEO keyword strategy. Take a high-performing blog post and promote it with ads. You can even use automation to bridge the gap; our guide on video email automation playbooks shows how to repurpose content to nurture leads from all your channels. This is where the real magic happens.

How to Use ROI Insights to Refine Your Strategy

Figuring out your marketing ROI isn't the finish line. It's the starting pistol.

The real power of this number isn't just knowing it; it's what you do with it. This is the moment you shift from simply measuring marketing to actively steering the company's growth. Your ROI data is a roadmap, pointing straight to your biggest wins and your most expensive leaks.

The first move is always to break down your ROI findings. A single, blended number is a decent health check, but the juicy, actionable insights are buried at the campaign and channel level. Once you start comparing them, you'll see a clear split between your workhorses and your money pits. This is your chance to make sharp, data-backed decisions instead of just going with your gut.

Doubling Down or Diagnosing Problems

When you find a channel or campaign with a stellar ROI, the obvious first step is to give it more fuel. If your LinkedIn ads are pulling in a 450% ROI, it's a strong signal to think about upping the budget.

But don't stop there. Dig deeper. What specific ad creative is killing it? Which targeting parameters are hitting the mark? What message is resonating so well? The real leverage comes from replicating those winning ingredients across your other campaigns. That's how you multiply your impact.

On the flip side, a low ROI isn't an automatic death sentence for a campaign. It's an invitation to put on your detective hat and figure out what's broken. A campaign with a negative return could be suffering from a simple, fixable issue that's holding it back from being a top performer.

Before you pull the plug, investigate these usual suspects:

  • Audience Mismatch: Are you actually talking to the right people? Your targeting might be way too broad or aimed at a group that just doesn't care.
  • Weak Creative or Offer: Is your ad copy boring? Is your offer a genuine solution to a real problem for the audience you're trying to reach?
  • Friction on the Landing Page: A confusing layout, a slow load time, or a clunky form can absolutely murder your conversion rates and sink your ROI.

Actionable Takeaway: A low ROI doesn't mean failure-it means you have a specific problem to solve. Pick your worst-performing campaign and run an A/B test on one variable this week: the headline, the call-to-action, or the primary image. This methodical testing can often turn an underperforming campaign into a profitable one.

Building Your Case for Future Budgets

Your historical ROI data is the single most persuasive tool you have for budget season. When you can walk into a meeting with a clear, data-driven projection, the entire conversation changes.

You're no longer just asking for money. You're presenting a business case for a predictable return on that investment.

Frame your request around concrete outcomes. For instance: "Last quarter, our paid search campaigns generated a 300% ROI. With an extra $50,000, we project we can bring in $150,000 in new revenue." This is a world away from a vague plea for more funds.

You can see how this plays out in the real world by checking out the marketing ROI success stories in our case studies. This is how you prove marketing isn't just a cost center-it's the engine that drives growth.

Free Tool

Try our Marketing Plan Generator — generate a complete AI-powered marketing plan in minutes. No signup required.

Common Questions About Marketing ROI

Even with the right formulas and data, a few questions always pop up when you start digging into your marketing ROI. Let's tackle the ones I hear most often so you can measure and interpret your numbers with more confidence.

What Is a Good Marketing ROI?

This is the million-dollar question, and the honest answer is: it depends.

You'll hear people throw around a 5:1 ratio-that's $5 in revenue for every $1 spent-as a general benchmark. But that number is pretty meaningless without context. A "good" ROI is completely relative to your industry, your profit margins, and the very nature of your business.

For instance, a high-margin software company could be thrilled with a 3:1 ROI, knowing that customer will likely stick around for years. On the other hand, a low-margin e-commerce business might need a 10:1 ratio just to break even after factoring in the cost of goods and shipping.

Actionable Takeaway: The best thing you can do is stop chasing a generic number. Instead, figure out your own baseline ROI and make it your mission to consistently beat it. Your real goal is to outperform your last quarter, not some arbitrary industry average. Calculate your overall marketing ROI for the last six months to establish your benchmark today.

How Do I Calculate ROI for Long-Term Strategies Like SEO?

Measuring the ROI for long-game channels like SEO or brand building requires a different mindset. You can't track them with the same instant gratification as a paid ad campaign. Instead, you have to get comfortable tracking the leading indicators that predict future revenue.

For SEO, that means you're watching metrics like:

  • Growth in organic traffic: More non-paid visitors is the clearest sign that your efforts are gaining traction.
  • New keyword rankings: Nailing top spots for high-value keywords is directly tied to future traffic and leads.
  • Leads from organic search: You have to track how many inquiries, sign-ups, or demo requests are coming straight from your organic efforts.

From there, you can start to assign a dollar value to these wins. Use your average lead-to-customer conversion rate and your customer lifetime value (CLV) to build a financial model. This lets you show the tangible, long-term impact of your SEO investment, even before all the revenue has hit the bank.

What Are the Most Common Mistakes When Calculating Marketing ROI?

I see marketers trip over the same few hurdles all the time. These mistakes can seriously skew your results and lead you to make some pretty bad decisions down the line.

Here are the big ones to watch out for, comparing the common mistake to the better approach:

Common MistakeThe Better ApproachWhy it Matters
Forgetting hidden costsInclude everything: software, freelance fees, and even a portion of team salaries.Forgetting these costs will make your ROI look way better than it actually is.
Relying on last-touch attributionUse a multi-touch model (like linear or time-decay) to see the whole customer journey.Last-touch devalues all the critical top-of-funnel work that got the customer there.
Measuring revenue instead of profitSubtract the Cost of Goods Sold (COGS) to calculate ROI based on gross profit.A campaign can drive huge revenue but still lose money if your margins are thin.
Ignoring long-term valueFactor in Customer Lifetime Value (CLV) when assessing a campaign's success.Focusing only on immediate sales is shortsighted and undervalues loyalty and retention.

At marketbetter.ai, we help you move beyond basic calculations. Our AI-powered platform gives you the deep attribution modeling and real-time analytics you need to not only measure your true ROI but also optimize it across every channel. See how you can connect your marketing efforts directly to profit by exploring our platform.

12 Lead Generation KPIs That Actually Predict Revenue (Not Vanity Metrics) [2026]

· 24 min read

Let's be honest. For a long time, the name of the game in marketing was just "more leads." We'd chase a big number, slap it on a slide, and call it a win.

But here’s the problem with that approach: more leads doesn't always mean more business. In fact, it often means more noise, more wasted time for your sales team, and a flatlining revenue chart that makes everyone scratch their head.

This is where we need to get smarter. We have to move past simply counting leads and start measuring what actually matters. That's what Lead Generation Key Performance Indicators (KPIs) are all about. They are the measurable values that tell you how effective you really are at generating new business.

Tracking these metrics is the difference between guessing and knowing. It’s how you make data-driven decisions that build a predictable growth engine for your company.

Why Tracking Leads Alone Is a Trap

Imagine a marketing team proudly announcing they doubled their lead count in a single quarter. High fives all around, right? But then the finance team runs the numbers and discovers revenue hasn’t budged an inch.

Sound familiar? This is the classic pitfall of focusing on quantity over quality.

An avalanche of leads is worthless if they're a bad fit, aren't ready to buy, or cost more to acquire than you'll ever see back in profit. Relying on that single, vanity metric—the raw number of leads—is dangerously misleading. It can make you feel successful while your business is actually standing still.

Moving Beyond the Vanity Metric

To avoid this trap, you need a more sophisticated toolkit. Think of your lead gen KPIs as the dashboard of your car. Just looking at the odometer (your lead count) tells you you're moving, but it's the other gauges that give you the critical context you need to actually get somewhere.

  • Your Speedometer: How fast are you bringing in qualified leads?
  • Your Fuel Gauge: Is your cost to acquire a customer sustainable, or are you about to run out of gas?
  • Your Engine Temp: Is your sales process efficient, or is it overheating with bad-fit prospects?

Without these other data points, you’re basically driving blind. You're burning fuel and hoping you end up at the right destination.

Relying solely on lead volume is like judging a restaurant's success by the number of people who walk through the door, not by how many actually sit down and order a meal. True performance is measured by conversion and profitability, not just foot traffic.

This guide will give you a practical framework to identify, track, and optimize the KPIs that truly matter. We're going to turn your lead generation from a guessing game into a predictable revenue driver. By the end, you'll know exactly how to connect your marketing efforts to bottom-line results, ensuring every dollar you spend is a smart investment in real, sustainable growth.

Understanding Your Foundational KPIs

If you want to get good at lead generation, you have to start with the basics: your foundational, top-of-funnel metrics. These are the core numbers that give you a quick pulse check on your marketing health. Think of them less as a final report card and more as the first few clues in solving your growth puzzle.

It's easy to get lost tracking dozens of different numbers, creating complex reports that hide more than they reveal. The real key is to focus on the vital few that tell the clearest story about how well you're grabbing your audience's initial attention.

This infographic breaks down the hierarchy of the most essential KPIs every marketer should be watching.

Infographic about lead generation key performance indicators

You can see how each metric builds on the last, moving from broad awareness to specific, measurable actions. Let's dig into what each one really tells you.

Number of Leads

This is the most basic KPI you can track: the raw Number of Leads. It’s your starting line.

Imagine you own a retail store. This number is simply counting every single person who walks through the front door. It's a non-negotiable metric because, without any foot traffic, you have zero chance of making a sale. But on its own, it’s just a raw count that tells you nothing about why they came in or if they actually want to buy something.

Actionable Insight: If your lead volume is too low, your immediate action is to broaden your reach. This could mean increasing your ad spend, expanding your keyword targeting, or testing new content formats to attract a larger audience. A sudden spike in leads might look great, but it could just mean you're attracting a crowd of window shoppers with no real intent.

Click-Through Rate (CTR)

Next up is your Click-Through Rate (CTR). If the number of leads is your total foot traffic, then CTR measures the effectiveness of your window display.

It tells you what percentage of people who saw your ad, email, or social media post were intrigued enough to actually click on it. The formula is simple:

(Total Clicks / Total Impressions) x 100 = CTR

Actionable Insight: A low CTR is a clear signal to rework your creative and messaging. Action Step: A/B test your headlines, images, and calls-to-action. For example, compare a benefit-driven headline ("Save 10 Hours a Week") against a curiosity-driven one ("The Secret to Effortless Project Management"). This direct comparison will show you what resonates with your audience. A high CTR, on the other hand, means your "window display" is successfully pulling people inside.

Conversion Rate

Once they're inside your "store," the Conversion Rate tells you what percentage of those visitors took the specific action you wanted them to. This doesn't have to be a final sale. For top-of-funnel marketing, a conversion is often something like:

  • Filling out a contact form
  • Downloading an ebook
  • Subscribing to your newsletter

The calculation is just as straightforward:

(Number of Conversions / Total Visitors) x 100 = Conversion Rate

Actionable Insight: A low conversion rate points to friction on your landing page. Action Step: Analyze your page for issues. Is your form too long? Is the call-to-action button hard to find? Compare a page with a 5-field form against one with a 3-field form. The shorter form will almost always convert better, showing you precisely how much friction your audience will tolerate. A high conversion rate means your page is doing its job.

By looking at these three KPIs together, you get the full story. High CTR but a low conversion rate? Your ad is great, but your landing page needs work. Low CTR but a high conversion rate? Your offer is a winner, but not enough of the right people are seeing it.

These foundational metrics work together to paint a clear picture of your campaign's performance from the very start. Nail these, and you're on your way to building a predictable and profitable marketing engine. For a deeper look at tracking and analyzing your core data, check out these crucial sales performance metrics.

Measuring the Cost and Efficiency of Your Leads

While it's great to know how many leads you're generating, those numbers don't tell the full story. To really understand your marketing's impact, you have to connect your efforts back to the budget. This is where cost-efficiency metrics come in, revealing the actual price tag on your lead gen machine.

These aren't just nice-to-have numbers; they're non-negotiable for proving marketing's value. They change the conversation from "how many leads did we get?" to "how much did we pay for them, and was it worth it?" This financial clarity is what lets you make smart budget decisions and justify every dollar spent.

Cost Per Lead (CPL): The Price of a Prospect

Cost Per Lead (CPL) is one of the most fundamental financial KPIs you can track. It tells you exactly what you paid, on average, to get a single person to raise their hand and show interest. Think of it as the cover charge for getting a potential customer into your club.

The math is simple:

Total Marketing Spend / Total New Leads = CPL

So, if you drop $5,000 on a Google Ads campaign and it brings in 100 new leads, your CPL is a clean $50. That number immediately gives you a baseline for that campaign's performance.

Actionable Insight: Tracking CPL by channel is critical. If your CPL from SEO is $25 but your CPL from paid ads is $75, you have a clear action item: analyze why your paid campaigns are so expensive. Are you targeting the wrong keywords? Is your ad quality score low? This comparison forces you to optimize your spend or shift budget to the more efficient channel. You can learn more about these important lead generation metrics from Abstrakt Marketing Group.

Before diving deep into channel-specific CPL, it helps to see a high-level comparison of what you might expect from different marketing avenues. Each channel has its own economic realities, with unique pros and cons that affect what you'll ultimately pay for a lead.

Comparing CPL Across Different Marketing Channels

Marketing ChannelAverage CPL (B2B)ProsCons
SEO/Content Marketing$20 - $75High-quality, long-term asset, builds authorityTakes time to see results, requires consistent effort
Email Marketing$40 - $60Nurtures existing database, cost-effective at scaleList fatigue is real, requires strong content
Social Media Ads$50 - $100Precise targeting, great for brand awarenessCan attract lower-intent leads, platform-dependent
PPC (e.g., Google Ads)$50 - $150+Captures active intent, highly measurable, fast resultsCan be very expensive, requires constant optimization
Webinars/Events$60 - $120Highly engaged leads, positions you as an expertHigh effort to produce, attendance can be unpredictable
LinkedIn Ads$75 - $200+Excellent for B2B targeting, professional contextOften the most expensive channel, ad fatigue is high

This table makes it clear that there's no single "best" channel. The right choice depends entirely on your budget, your audience, and whether you're playing the long game or need results right now.

Cost Per Acquisition (CPA): The Cost of a Customer

CPL measures the cost of a potential customer, but Cost Per Acquisition (CPA) goes one crucial step further. It measures the average cost to land an actual paying customer. This is the bottom-line metric because it ties your marketing spend directly to closed deals and revenue.

The formula is just as straightforward, but it focuses on the finish line:

Total Marketing Spend / Total New Customers = CPA

If that same $5,000 campaign ultimately produced 10 paying customers, your CPA would be $500. This is the number that answers the most important question of all: how much does it really cost us to win?

CPL vs. CPA: An Actionable Comparison

Knowing the difference between CPL and CPA is what separates tactical marketers from strategic ones. A cheap CPL is a vanity metric if those leads never, ever convert. The real magic happens when you look at both numbers side-by-side to judge your channels.

Let's walk through a real-world scenario:

  • Channel A (Google Ads): You spend $2,000 and get 100 leads ($20 CPL). Of those, 2 become customers ($1,000 CPA).
  • Channel B (LinkedIn Ads): You spend $2,000 and get 40 leads ($50 CPL). Of those, 5 become customers ($400 CPA).

At first glance, Google Ads looks like the clear winner with a $20 CPL—it's less than half of what LinkedIn costs! But the CPA tells the real story. The leads from LinkedIn, while more expensive up front, were far higher quality and converted at a much better clip. The result? A dramatically lower CPA.

This comparison reveals a powerful truth: Obsessing over a low CPL can trick you into pouring money into channels that generate cheap, junk leads, which ultimately costs you more to land a real customer.

To make this data actionable, your team would shift more budget toward Channel B. By focusing on the channel with the better CPA, you’re putting your resources where they generate the most profitable growth. This is the kind of data-driven decision that turns a marketing team from a cost center into a predictable revenue engine.

How to Measure Lead Quality and Sales Readiness

A team of marketers reviewing sales readiness charts and data on a large screen in a modern office.

So far, we’ve been talking about getting attention and figuring out what it costs. But a cheap lead that goes nowhere is just a waste of time and money. A low Cost Per Lead (CPL) is a vanity metric if those leads have zero shot at becoming customers.

This is where we pivot from a numbers game to a quality game. We’re moving into the lead generation key performance indicators that build the bridge between your marketing efforts and your sales team’s success. It’s time to stop asking "how many?" and start asking "how good?"

Let’s be honest: not all leads are created equal. Some are just kicking the tires, while others are pulling out their wallets. Telling the difference between the two is the secret sauce to an efficient sales process and a pipeline that actually delivers.

MQL vs. SQL: What Is the Difference?

To figure out lead quality, you first have to agree on what a "good" lead actually looks like. This brings us to two of the most critical acronyms in the business: Marketing Qualified Lead (MQL) and Sales Qualified Lead (SQL). Getting this right is everything.

A simple comparison helps clarify the distinction:

  • An MQL is someone who downloaded a top-of-funnel ebook. They are problem-aware.
  • An SQL is someone who requested a personalized demo. They are solution-aware and showing purchase intent.

The MQL is curious; the SQL is serious. Your marketing team's job is to nurture the curious MQLs, while your sales team's job is to close the serious SQLs.

The core difference isn't just their level of interest; it's their readiness for a sales conversation. MQLs are nurtured by marketing, while SQLs are actively pursued by sales.

Nailing this definition demands a tight alignment between marketing and sales. Both teams have to agree on the exact criteria that graduate a lead from MQL to SQL. This shared rulebook stops marketing from just "throwing leads over the wall" that sales will inevitably ignore.

MQL-to-SQL Conversion Rate

Once your definitions are locked in, you can track the single most important handoff metric between your teams: the MQL-to-SQL Conversion Rate. This KPI tells you how well your marketing is setting up real, valuable opportunities for sales.

The math is simple:

(Total SQLs / Total MQLs) x 100 = MQL-to-SQL Conversion Rate

Actionable Insight: A low MQL-to-SQL rate is a red flag signaling a disconnect. Action Step: Hold a joint marketing and sales meeting to review the last 20 leads that sales rejected. Was the lead's company too small? Were they in the wrong industry? This direct feedback loop is the fastest way to refine your MQL criteria and improve lead quality immediately.

For instance, if your marketing team generates 200 MQLs in a month and sales accepts 20 of them as SQLs, your conversion rate is 10%. Watching this number over time is how you find and fix the leaks in your funnel.

Implementing a Simple Lead Scoring System

So, how do you decide which MQLs are ready for prime time in a way that isn't just guesswork? The answer is lead scoring. It’s a system where you assign points to leads based on who they are and what they do, creating a score that signals their sales readiness.

Instead of relying on gut feelings, you build an objective, data-backed process. A higher score means a hotter lead, telling your sales team exactly where to focus their energy.

Here’s a basic framework you can put to work today.

1. Identify Key Behavioral Triggers

These are the actions a person takes that show they're interested.

  • Requesting a demo: +25 points (This is a big one)
  • Visiting the pricing page: +15 points
  • Downloading a case study: +10 points
  • Attending a webinar: +10 points
  • Opening a marketing email: +2 points

2. Define Important Demographic or Firmographic Data

This is all about who they are and where they work.

  • Job title (e.g., Director or VP): +15 points
  • Company size (matches your Ideal Customer Profile): +10 points
  • Industry (your target vertical): +10 points

By adding up these scores, you can set a clear threshold. For example, any lead who hits 50 points is automatically flagged as an SQL and routed to a salesperson. This ensures your team spends their precious time on the opportunities most likely to close.

If you want to go deeper, you can find a more advanced look at building these systems in our guide to AI lead scoring.

Connecting Your KPIs to Revenue and Growth

At the end of the day, marketing is here for one reason: to grow the business. While metrics like CTR and CPL are great for taking the temperature of a campaign, they don’t speak the language of the C-suite. To prove marketing’s real value, you have to draw a straight, undeniable line from your lead generation key performance indicators to actual revenue.

This is the jump from measuring activities to measuring impact. It's about showing how a click on a social media ad turned into a signed contract in your CRM. When you can do that, you stop being a cost center and become a predictable, powerful growth engine.

Customer Lifetime Value (CLV): The Ultimate Context

The single most powerful metric in this conversation is Customer Lifetime Value (CLV). In simple terms, CLV is the total revenue you can expect to earn from a single customer over the entire time they do business with you. It’s the long-term view that puts all your short-term spending into perspective.

Actionable Insight: Compare your Customer Acquisition Cost (CPA) to your CLV. A healthy business model typically aims for a CLV:CPA ratio of at least 3:1. If your ratio is 1:1, you're losing money with every new customer. Action Step: If your ratio is too low, you have two levers to pull: either find ways to decrease your CPA (by optimizing ad spend) or increase your CLV (by improving customer retention and upselling).

CLV is the KPI that gives you permission to spend more to acquire the right customers. It shifts the focus from finding the cheapest leads to finding the most profitable ones.

This one number reframes your entire strategy. Instead of hunting for the lowest CPL, you start hunting for the highest CLV—a fundamentally smarter, more profitable way to grow.

Lead-to-Close Ratio: Your Sales Efficiency Score

While CLV is your long-term lens, the Lead-to-Close Ratio (sometimes called Lead Conversion Rate) is your snapshot of how efficiently your sales process is working right now. It tells you exactly what percentage of the leads you generate actually become paying customers.

The math is simple:

(Total New Customers / Total Leads) x 100 = Lead-to-Close Ratio

If you generated 200 leads last month and 10 of them signed on the dotted line, your Lead-to-Close Ratio is 5%. This is a crucial health check on your sales effectiveness. A consistently low ratio is a red flag—it might mean you're chasing low-quality leads, or there’s a serious bottleneck somewhere in your sales funnel.

A Tale of Two Channels: A Case Study in Profitability

Let's put this all together with a real-world example. Imagine a B2B SaaS company running lead gen campaigns on two different channels.

  • Channel A (Social Media Ads): This channel was a CPL machine, generating leads at a ridiculously low $40 CPL. The marketing team loved it. The problem? These leads had a dismal Lead-to-Close Ratio of just 1% and a CLV of $1,500.
  • Channel B (Industry Webinars): The leads from here were way more expensive, costing $150 CPL. This looked inefficient at first glance. But these were high-intent, engaged leads with a Lead-to-Close Ratio of 8% and a massive CLV of $12,000.

If you only looked at CPL, Channel A would win every time. But when you connect the dots to revenue, the story completely flips.

To land one customer from Channel A, they needed 100 leads. That cost them $4,000 (100 leads x $40 CPL) for a $1,500 return. Ouch.

Meanwhile, Channel B only required about 13 leads to get one customer (100 / 8). The acquisition cost was just $1,950 (13 leads x $150 CPL) for a whopping $12,000 return.

By shifting their budget away from the "cheap" CPL channel and toward the high-CLV one, the company supercharged its profitability. This is why it's so important to look past surface-level metrics and understand how to measure marketing ROI to prove your team's true impact on the business.

Building Your Actionable KPI Dashboard

A marketing team collaborating around a large screen displaying an actionable KPI dashboard.

Tracking individual lead generation key performance indicators is a great start, but looking at them one by one is like trying to navigate a city by only looking at a single street sign. You get a piece of the picture, but you have no context. A real KPI dashboard pulls all that data together, transforming scattered metrics into a clear story that actually guides your strategy.

Think about your car's dashboard. You don't get separate, random alerts for low fuel, engine temperature, and tire pressure. You get one central display that gives you the full picture at a glance. That's what a good marketing dashboard does. It lets you make faster, smarter decisions instead of getting lost in a dozen different spreadsheets.

The goal is to create a single source of truth. It kills data silos and gets everyone, from marketing ops to the C-suite, working from the same playbook. It’s about clarity, not clutter.

Choosing the Right KPIs for Your Audience

This is where most teams go wrong. They build a single, monstrous dashboard that tries to show everything to everyone. The result? It's overwhelming, and nobody uses it. The secret is tailoring the view to the person looking at it, because different teams need to see wildly different things.

  • For the Marketing Team (The Operational View): This is your tactical command center, updated daily or weekly. It needs the nitty-gritty details: Cost Per Lead (CPL) by channel, landing page conversion rates, and MQL volume. Action Step: If CPL on one channel spikes, the team's immediate action is to pause that ad set and investigate.
  • For Leadership (The Strategic View): This is the big-picture view, reviewed monthly or quarterly. Forget the tactical weeds. This dashboard needs to focus on the metrics that tie directly to the bottom line: Customer Acquisition Cost (CPA), Customer Lifetime Value (CLV), and total marketing ROI. Action Step: If the CLV:CPA ratio dips below 3:1, leadership's action is to question the profitability of a channel and decide on budget reallocation for the next quarter.

By creating these distinct views, you give each person exactly what they need to make decisions. The data starts driving real conversations instead of just being numbers on a screen. And as your data game gets more sophisticated, you can layer in advanced tactics like those in our guide to person-level identification to make your dashboards even sharper.

An effective dashboard doesn't just report what happened. It gives you the context to understand why it happened and what to do next. It turns reactive data-checking into proactive strategy.

Checklist for Your First Dashboard

You don't need a data science degree to build your first dashboard. Start simple. Tools like Google Data Studio or even your CRM’s built-in reporting can get you surprisingly far.

Here’s a quick checklist to get you started:

  1. Define the Goal: What’s the single most important question this dashboard must answer? (e.g., "How efficiently are we acquiring new customers?")
  2. Identify the Audience: Who is this for? The marketing team? Sales? The CEO?
  3. Select 5-7 Core KPIs: Pick only the essential metrics that directly answer the main question for that audience. No vanity metrics allowed.
  4. Connect Your Data Sources: Hook up your analytics, CRM, and ad platforms.
  5. Visualize the Data: Use clear charts and graphs. A timeline for trends, a pie chart for channel mix—make it tell a story.
  6. Set a Review Cadence: Put it on the calendar. Schedule regular check-ins to actually discuss the data and decide on next steps.
Free Tool

Try our AI Lead Generator — find verified LinkedIn leads for any company instantly. No signup required.

A Few Common Questions About Lead Gen KPIs

Alright, we've covered the what and the why. But when the rubber meets the road, practical questions always pop up. How many of these things should you actually stare at? And how often? Let's get into the real-world answers.

How Many KPIs Should I Actually Track?

It’s incredibly tempting to measure everything. More data feels safer, right? But this almost always leads to "analysis paralysis," where you're drowning in numbers but have no idea what to do next.

Instead of tracking a dozen-plus metrics, zero in on a core set of 5-7 KPIs that truly connect to your main business goals.

A solid way to start is by picking one or two from each part of your funnel:

  • Top-of-Funnel: Click-Through Rate (CTR) or Cost Per Lead (CPL)
  • Mid-Funnel: MQL-to-SQL Conversion Rate
  • Bottom-of-Funnel: Customer Acquisition Cost (CPA) and Lead-to-Close Ratio
  • Big Picture: Customer Lifetime Value (CLV)

This gives you a complete, high-level view of what's happening without bogging your team down in noise.

Don't mistake motion for progress. A cluttered dashboard with 20 metrics is less useful than a focused one with five that actually drive action. The real goal is clarity, not complexity.

How Often Should I Review My KPIs?

The right cadence isn't one-size-fits-all. It completely depends on the metric itself and who's looking at it. Trying to review everything on the same schedule is a recipe for bad decisions.

A practical comparison for review frequency:

  • Weekly Review (Marketing Team): Focus on fast-moving, tactical KPIs like CPL, CTR, and Conversion Rates. These are the levers you can pull immediately to optimize live campaigns.
  • Monthly Review (Sales & Marketing Leadership): Focus on pipeline velocity KPIs like MQL-to-SQL Conversion Rate and Lead-to-Close Ratio. This cadence allows enough time for leads to move through the funnel and reveals trends.
  • Quarterly Review (Executive Team): Focus on strategic, slow-moving KPIs like CPA and CLV. These metrics reflect the overall health and profitability of the business and inform major budget decisions for the next quarter.

Matching the review frequency to the metric’s purpose is key. It stops you from overreacting to daily blips in big-picture numbers while keeping you agile enough to fix the small things that are happening right now.


Ready to stop guessing and start growing? marketbetter.ai uses AI to help you optimize every stage of your funnel, from the first click to the final close. See how our platform can help you turn your KPIs into predictable revenue. Learn more about what marketbetter.ai can do for you.

10 Actionable Customer Segmentation Strategies for 2026

· 27 min read

In 2025, generic marketing messages are just noise. To capture attention and drive revenue, businesses must understand their customers on a deeper, more actionable level. This isn't about simply knowing who they are, but why they buy, how they behave, and what they truly need. The key to unlocking this understanding lies in deploying effective customer segmentation strategies.

This guide moves beyond surface-level definitions to provide an actionable, comparative roundup of the 10 most powerful approaches available today. We will dissect each strategy, compare its strengths and weaknesses, provide real-world examples, and offer step-by-step guidance on implementation. You will learn not just what each model is, but when to use it, how it compares to others, and the specific data required to make it work.

We will cover everything from foundational models like demographic and behavioral segmentation to more advanced approaches such as value-based and technographic segmentation. Each item is designed to provide a clear, practical framework for immediate application. To gain further insights into applying these methods, especially in a SaaS context, consider exploring this article on Top Customer Segmentation Strategies for SaaS. By the end of this comprehensive listicle, you'll have a clear roadmap for choosing and applying the right segmentation models to personalize your marketing, optimize your campaigns, and achieve measurable, sustainable growth.

1. Demographic Segmentation

Demographic segmentation is one of the most foundational and widely used customer segmentation strategies. It involves dividing your market into distinct groups based on observable, statistical characteristics. This approach operates on the principle that individuals with similar demographic profiles often share similar purchasing habits, needs, and media consumption patterns.

The primary variables used in this method include:

  • Age and Life Cycle Stage: Needs change dramatically from toddler to teenager to adult.
  • Gender: Certain products are inherently marketed differently to men and women.
  • Income and Occupation: Disposable income and professional roles heavily influence spending power and priorities.
  • Education Level and Family Size: These factors can impact lifestyle choices and product needs.

By leveraging this data, which is often readily available through surveys, census data, or analytics platforms, businesses can create broad but effective audience profiles.

When to Use Demographic Segmentation

This strategy is an excellent starting point for nearly any business. It’s particularly effective for mass-market products where broad trends are important. For example, a luxury car brand like Mercedes-Benz targets high-income individuals, while a toy company like LEGO focuses on households with children in specific age brackets. Similarly, AARP tailors its services exclusively for people aged 50 and over, a classic use of age-based demographic segmentation.

Key Insight: While powerful for initial targeting, demographic data reveals who is buying, but not why they are buying. For deeper insights, it must be combined with other segmentation types like psychographic or behavioral.

Actionable Tips for Implementation

  • Go Beyond the Obvious: Instead of just segmenting by "age," create a segment for "Millennials entering homeownership" which combines age with a life-cycle stage for more precise targeting.
  • Combine and Conquer: Layer demographic data with behavioral or geographic insights. A high-income urban Millennial behaves differently from a high-income suburban Gen X-er.
  • Keep Data Fresh: Demographics are not static. People age, change jobs, and move. Regularly update your customer data to ensure your segments remain accurate and relevant.

The following summary box visualizes how key demographic variables can be broken down for analysis.

Infographic showing key data about Demographic Segmentation

This visual breakdown highlights how a market can be segmented into distinct, quantifiable groups, allowing marketers to allocate resources more effectively. These clear distinctions form the basis of many successful customer segmentation strategies.

2. Psychographic Segmentation

Psychographic segmentation moves beyond the "who" of demographics to uncover the "why" behind consumer behavior. It categorizes customers based on psychological attributes like personality, values, attitudes, interests, and lifestyles (often summarized as AIO variables: Activities, Interests, and Opinions). Where demographics provide a skeleton, psychographics add the personality and motivation.

The primary variables used in this method include:

  • Lifestyle: How a person spends their time, from hobbies and entertainment to daily routines.
  • Values and Beliefs: Core principles that guide a person's decisions, such as environmentalism, family, or tradition.
  • Personality Traits: Characteristics like being an introvert, adventurer, or innovator.
  • Interests and Opinions: Attitudes towards social issues, politics, business, and specific products.

By analyzing these deeper motivations, businesses can craft messaging that resonates on an emotional and personal level, fostering stronger brand loyalty.

When to Use Psychographic Segmentation

This strategy is exceptionally powerful for brands in crowded markets where emotional connection is a key differentiator. It's ideal for products tied to identity, status, or personal values. For instance, Patagonia’s success is built on appealing to environmentally conscious outdoor enthusiasts who value sustainability. Similarly, Harley-Davidson targets a specific persona of freedom-seeking individualists, a psychographic profile that transcends age or income. Whole Foods Market also uses this approach by targeting consumers who prioritize health, wellness, and social responsibility in their purchasing decisions.

Key Insight: Psychographic segmentation provides the rich, qualitative context that demographic data lacks. It explains why a high-income, 30-year-old urban professional chooses a specific brand over its direct competitors, revealing their core motivations.

Actionable Tips for Implementation

  • Conduct In-Depth Research: Use surveys with Likert scale questions (e.g., "On a scale of 1-5, how important is sustainability in your purchases?") to quantify attitudes.
  • Leverage Social Media Insights: Monitor social media conversations and followings related to your brand to understand the interests and opinions of your audience.
  • Use Established Frameworks: Consider models like the VALS (Values and Lifestyles) framework as a structured starting point for classifying consumers into psychographic types.
  • Create Rich Personas: Build out your customer personas with psychographic details. Instead of just "Jane, 35," define "Eco-Conscious Jane," who values sustainability and community.

3. Behavioral Segmentation

Behavioral segmentation is one of the most powerful customer segmentation strategies, as it groups customers based on their actions and interactions with your brand. Unlike psychographics, which focuses on internal motivations, this method analyzes observable actions. It operates on the core principle that past behavior is one of the strongest predictors of future actions.

Behavioral Segmentation

The primary variables used in this data-driven approach include:

  • Purchase History: What products they buy, how often, and the average order value.
  • Usage Rate: How frequently they use a product or service (heavy, medium, or light users).
  • Brand Loyalty: Their level of commitment to your brand versus competitors.
  • Benefits Sought: The specific value they look for in a product, such as convenience, price, or quality.
  • Customer Journey Stage: Where they are in the lifecycle, from awareness to loyal advocate.

This method allows businesses to move beyond assumptions and create hyper-personalized marketing campaigns that resonate with demonstrated customer habits.

When to Use Behavioral Segmentation

This strategy is exceptionally effective for e-commerce, SaaS, and any business with a digital footprint where user actions can be easily tracked. For instance, Amazon's recommendation engine is a masterclass in behavioral segmentation, suggesting products based on a user's browsing and purchase history. Similarly, Spotify creates personalized playlists like "Discover Weekly" by analyzing listening habits, while the Starbucks Rewards program segments users by visit frequency and spending to offer tailored rewards.

Key Insight: Behavioral segmentation directly links marketing efforts to measurable actions. It reveals the why behind a purchase by focusing on the triggers and patterns that lead to conversion, making it highly actionable for personalization and retention campaigns.

Actionable Tips for Implementation

  • Implement RFM Analysis: For e-commerce, use Recency, Frequency, and Monetary value to identify your most valuable customers. Target high-RFM customers with loyalty perks and low-RFM customers with re-engagement offers.
  • Track Customer Lifecycle Stages: Segment users based on where they are in their journey. A new user needs onboarding content, while a long-time loyal customer might appreciate an exclusive preview.
  • Leverage Abandoned Cart Data: Create specific, automated email campaigns for users who abandon their carts, offering a reminder, a small discount, or social proof to encourage them to complete the purchase.

4. Geographic Segmentation

Geographic segmentation divides a market based on location, recognizing that customer needs and purchasing habits often vary significantly depending on where they live. While simpler than behavioral or psychographic methods, it provides essential context for product offerings and messaging. It operates on the principle that local culture, weather, and regulations directly influence consumer behavior.

Geographic Segmentation

The primary variables used in this customer segmentation strategy include:

  • Location: Ranging from global regions (e.g., North America, Southeast Asia) down to specific neighborhoods or postal codes.
  • Climate and Season: Weather conditions dictate demand for products like air conditioners, snow blowers, and seasonal apparel.
  • Population Density: Urban, suburban, and rural consumers have vastly different lifestyles, accessibility to stores, and needs.
  • Cultural Preferences: Local traditions and tastes can impact everything from product flavors to marketing messages.

By analyzing these geographic factors, businesses can make their products and campaigns more relevant to the people in a specific area, increasing engagement and sales.

When to Use Geographic Segmentation

This strategy is essential for businesses operating in multiple regions, whether nationally or internationally. It is particularly powerful for retail, food and beverage, and automotive industries. For instance, a fast-food chain like McDonald's adapts its menu to local tastes, offering the McSpicy Paneer in India and the Teriyaki McBurger in Japan. Similarly, The Home Depot stocks hurricane supplies in coastal Florida but prioritizes snow removal equipment in northern states like Minnesota. This approach ensures product offerings align with immediate, location-specific needs.

Key Insight: Geographic segmentation is about more than just language translation; it's about cultural and environmental translation. True success comes from understanding how a location shapes a customer's daily life and purchasing decisions.

Actionable Tips for Implementation

  • Combine with Demographics: Create "geodemographic" segments. For example, target high-income urban dwellers in New York City differently from high-income families in a Dallas suburb.
  • Leverage Localized Marketing: Run geo-targeted ad campaigns on platforms like Google Ads or Facebook to show specific offers to users within a certain radius of your store.
  • Adapt Products and Services: Don't assume a one-size-fits-all product will succeed everywhere. Analyze local climate, preferences, and regulations to make necessary adjustments.
  • Monitor Regional Economics: Keep an eye on local economic conditions, such as employment rates or housing market trends, as they directly affect the purchasing power within a segment.

5. Firmographic Segmentation (B2B)

Firmographic segmentation is the business-to-business (B2B) equivalent of demographic segmentation. It involves classifying organizations into distinct groups based on shared, observable company characteristics. While demographics focus on people, firmographics focus on organizations, providing a crucial framework for B2B targeting.

The primary variables used in this B2B-focused method include:

  • Industry: Classifying companies by their sector (e.g., SaaS, manufacturing, healthcare).
  • Company Size: Measured by annual revenue or number of employees.
  • Location: Geographic concentration, from country and state down to a specific city or region.
  • Organizational Structure: Such as privately held, publicly traded, or non-profit.

By leveraging firmographic data, B2B marketers can move beyond a one-size-fits-all approach and tailor their messaging, product offerings, and sales outreach to the specific context of their target accounts.

When to Use Firmographic Segmentation

This strategy is essential for any B2B company looking to implement an efficient and scalable sales or marketing motion. It is the cornerstone of Account-Based Marketing (ABM) and is crucial for creating Ideal Customer Profiles (ICPs). For instance, Salesforce offers distinct CRM solutions for small businesses versus global enterprises, a classic application of segmentation by company size. Similarly, a cybersecurity firm might focus its efforts on financial services and healthcare companies, industries where data security is a high-stakes priority.

Key Insight: Firmographic data tells you which companies to target, but not who within those companies holds the buying power or what technologies they currently use. It provides the "where to look," but must be layered with other data for precision.

Actionable Tips for Implementation

  • Build Your Ideal Customer Profile (ICP): Define the firmographic attributes of your best customers (e.g., "SaaS companies with 50-200 employees in North America") to focus your acquisition efforts.
  • Segment by Growth Stage: A fast-growing startup has different needs and a more agile buying process than a mature, established enterprise. Tailor your outreach accordingly.
  • Leverage B2B Data Tools: Use platforms like ZoomInfo, Clearbit, or the filters within LinkedIn Sales Navigator to gather accurate firmographic data. You can learn more about how to do this with LinkedIn prospecting automation.
  • Combine with Technographic Data: Enhance firmographic segments by layering in technographic data (the technologies a company uses). Targeting companies that use a complementary or competitive technology stack is a highly effective tactic.

6. Value-Based Segmentation

Value-based segmentation shifts the focus from who the customer is to what they are worth to the business. This highly strategic approach groups customers according to their economic value, which is typically measured by metrics like profitability, revenue potential, and most importantly, customer lifetime value (CLV). Unlike behavioral segmentation, which tracks actions, this model focuses solely on the financial impact of those actions.

The primary variables used in this method include:

  • Customer Lifetime Value (CLV): A prediction of the total profit a business will make from a customer throughout their entire relationship.
  • Average Order Value (AOV): The average amount a customer spends per transaction.
  • Purchase Frequency: How often a customer makes a purchase within a specific timeframe.
  • Profitability per Customer: The net profit attributed to a customer after accounting for all associated costs.

By analyzing these financial metrics, businesses can allocate resources, like marketing spend and customer service attention, much more effectively.

When to Use Value-Based Segmentation

This strategy is indispensable for businesses with varying customer profitability, especially in industries with high customer acquisition costs. It’s perfect for companies looking to optimize their loyalty programs, premium service offerings, and account management resources. For example, an airline’s tiered loyalty program (Silver, Gold, Platinum) is a classic application, offering superior perks to travelers who spend the most. Similarly, financial institutions provide private banking services with dedicated advisors exclusively for their high-net-worth clients, ensuring top-tier retention.

Key Insight: Value-based segmentation allows you to treat your best customers best. It moves marketing away from a one-size-fits-all model toward a system where investment is directly proportional to expected returns.

Actionable Tips for Implementation

  • Develop a CLV Model: Build a robust model that incorporates purchase history, frequency, and churn rate. A crucial aspect of value-based segmentation involves accurately estimating each customer's long-term potential, and further insights can be found on embedding domain knowledge for estimating customer lifetime value.
  • Create Tiered Service Levels: Design exclusive benefits, priority support, or special access for your top-tier customers, as Sephora does with its VIB Rouge program. This enhances loyalty and encourages lower-tier customers to spend more.
  • Identify High-Potential Customers Early: Use predictive analytics and AI-powered tools to spot new customers who exhibit behaviors similar to your existing high-value segment. Discover how you can implement this with AI-powered lead scoring.
  • Target Win-Back Campaigns: Don’t just focus on current high-value customers. Create targeted campaigns to re-engage previously valuable customers who have become inactive.

7. Needs-Based Segmentation

Needs-based segmentation is a powerful customer-centric strategy that groups customers based on the specific problems they are trying to solve or the benefits they are seeking. Instead of focusing on who the customers are (demographics) or what they have done (behavioral), this approach prioritizes the why behind their purchase decisions. It is built on the understanding that customers "hire" products or services to get a job done.

This method requires a deep understanding of customer motivations, pain points, and desired outcomes. Key variables include:

  • Functional Needs: The practical, tangible requirements a customer has (e.g., a car that is fuel-efficient).
  • Emotional Needs: The feelings a customer wants to experience (e.g., feeling secure or successful).
  • Social Needs: How a customer wants to be perceived by others (e.g., seen as environmentally conscious).
  • Specific Pain Points: The frustrations or challenges a customer is currently facing.

By identifying these core needs, businesses can align product development, messaging, and service delivery to provide maximum value to distinct customer groups.

When to Use Needs-Based Segmentation

This strategy is exceptionally effective for product innovation, value proposition design, and competitive markets where differentiation is key. It helps businesses move beyond feature-based competition to create solutions that genuinely resonate. For example, Airbnb successfully caters to diverse traveler needs: budget-conscious backpackers, families needing space, business travelers seeking amenities, and luxury seekers wanting unique experiences. Similarly, Nike offers distinct product lines for various athletic needs, from elite marathon runners to casual gym-goers.

Key Insight: Needs-based segmentation uncovers the true "job" a customer is trying to accomplish. This shifts the focus from selling a product to providing a solution, which builds stronger customer loyalty and pricing power.

Actionable Tips for Implementation

  • Embrace the "Jobs-to-be-Done" Framework: Use this theory, popularized by Clayton Christensen, to uncover the underlying progress your customers are trying to make when they buy your product.
  • Conduct Voice-of-Customer Research: Use in-depth interviews, surveys, and focus groups to directly ask customers about their challenges, goals, and frustrations.
  • Map Features to Needs: Create a clear matrix that links each of your product's features to the specific customer needs it fulfills. This helps prioritize development and refine marketing messages.
  • Build Need-Based Personas: Develop customer personas that are defined by their goals and pain points rather than just their demographic profiles. Understanding these motivations allows for more effective person-level identification and targeting.

The video below offers a deeper dive into the "Jobs-to-be-Done" theory, which is a cornerstone of effective needs-based customer segmentation strategies.

By understanding the "why," you can create more compelling offers and build a more resilient brand that is anchored in solving real customer problems.

8. Technographic Segmentation

Technographic segmentation groups customers based on the technology they use, from their hardware and software stack to their preferred digital platforms. This modern approach is crucial in a tech-driven world, especially for B2B companies, SaaS providers, and digital agencies. It provides a technical layer of insight that firmographic data alone cannot, showing how a company works, not just what it is.

The primary variables used in this method include:

  • Software Stack: CRM, ERP, marketing automation, or analytics platforms currently in use.
  • Hardware: Server infrastructure, mobile devices, or other physical tech.
  • Digital Adoption: Usage of social media platforms, cloud services, or e-commerce technologies.
  • Technical Sophistication: From early adopters of cutting-edge tech to laggards using legacy systems.

By analyzing this data, businesses can pinpoint opportunities, predict needs, and tailor their messaging to a prospect's specific technological environment.

When to Use Technographic Segmentation

This strategy is indispensable for technology companies and B2B marketers. It enables highly targeted and relevant outreach that speaks directly to a prospect’s existing infrastructure. For instance, a cybersecurity firm can target companies using specific cloud platforms known to have certain vulnerabilities. Similarly, HubSpot can identify businesses using a competitor’s marketing automation tool and create a campaign highlighting its superior features and seamless migration process. A Shopify app developer would use it to target merchants who already have a complementary app installed, ensuring a perfect product fit.

Key Insight: Technographic data tells you how a customer operates. This is a powerful advantage over competitors using broader strategies, as it allows you to frame your product not just as a solution, but as the next logical step in their technology evolution.

Actionable Tips for Implementation

  • Leverage Data Tools: Use platforms like BuiltWith, Datanyze, or Clearbit to uncover the technology stacks of your target accounts without manual research.
  • Target Complementary Tech: Identify companies using technologies that integrate well with your own. If you sell a specialized analytics tool, target users of CRMs that you have a native integration with.
  • Segment by Adoption Curve: Classify prospects based on Everett Rogers' "Diffusion of Innovation" theory. Target "early adopters" for beta programs and "early majority" for scalable, proven solutions.
  • Create Competitive Campaigns: Directly target users of competing software. Highlight your key differentiators, offer competitive pricing, or showcase an easier user interface to encourage them to switch.

9. Generational Segmentation

Generational segmentation divides a market based on the shared life experiences of different birth cohorts. This strategy operates on the idea that historical events, technological changes, and cultural shifts during a person's formative years create distinct values, attitudes, and purchasing behaviors. It's a specific application of demographic (age) and psychographic (values) segmentation, combining them into powerful, culturally relevant profiles.

The primary variables in this method group people by their shared context:

  • Baby Boomers (born ~1946-1964): Shaped by post-war optimism and economic growth.
  • Generation X (born ~1965-1980): Known for independence and skepticism, having grown up during a time of social change.
  • Millennials (born ~1981-1996): The first digitally native generation, valuing experiences and authenticity.
  • Generation Z (born ~1997-2012): True digital natives, prioritizing social responsibility, inclusivity, and short-form content.

By analyzing these generational lenses, businesses can tailor messaging, product features, and communication channels to resonate more deeply with each group’s core motivations.

When to Use Generational Segmentation

This approach is highly effective for brands whose products or messaging rely heavily on cultural relevance, values, or communication styles. For instance, TikTok’s entire platform is built around the short-form, trend-driven video content that appeals directly to Gen Z. In contrast, AARP successfully serves Baby Boomers by focusing its products and content on retirement, health, and financial security, which are key concerns for that generation. It's also useful for financial services, where Robinhood captured Millennial and Gen Z investors with its mobile-first, commission-free trading model that challenged traditional brokerage firms.

Key Insight: Generational segmentation provides a powerful cultural context that demographic age data alone lacks. However, it's crucial to avoid broad stereotypes, as individual behavior within a generation can vary significantly.

Actionable Tips for Implementation

  • Avoid Stereotypes: Use generational traits as a starting point, not a rigid rule. A Millennial parent has different needs than a Millennial just entering the workforce.
  • Adapt Communication Channels: Engage Gen Z on platforms like TikTok and Instagram, Millennials through social media and email, and Baby Boomers via Facebook and more traditional channels.
  • Focus on Core Values: Align your brand’s message with the values that define a generation. For Gen Z, this might mean highlighting sustainability and ethical practices.
  • Layer with Other Segments: Combine generational insights with behavioral or psychographic data for a more nuanced and accurate customer profile. A high-income, urban Millennial will have different priorities than a rural one.

10. Occasion-Based Segmentation

Occasion-based segmentation is a powerful strategy that groups customers based on specific moments or situations when they purchase or use a product. This approach moves beyond who the customer is (demographics) or what they think (psychographics) to focus on the context of their buying decision. It is a subset of behavioral segmentation, but it focuses specifically on the timing and triggers of behavior rather than on long-term patterns.

The primary variables in this method revolve around timing and context:

  • Time of Day/Week/Year: Promoting different meal types at different times (e.g., breakfast vs. late-night snacks).
  • Life Events: Targeting customers during major milestones like weddings, graduations, or anniversaries.
  • Holidays and Seasons: Aligning marketing with specific holidays like Valentine's Day or seasonal needs like summer travel.
  • Usage Situation: Differentiating between a product used for a routine personal need versus one purchased as a special gift.

By understanding the context of a purchase, businesses can deliver highly relevant offers and messages precisely when customers are most receptive. This is a key element of effective customer segmentation strategies.

When to Use Occasion-Based Segmentation

This strategy is exceptionally effective for industries where context heavily influences purchasing decisions, such as retail, food and beverage, and travel. For example, a greeting card company like Hallmark segments its entire business around occasions: birthdays, holidays, and sympathy. Similarly, Coca-Cola markets its products differently for a family meal compared to a large social party or on-the-go refreshment. Hotels also use this by targeting business travelers with different packages during the week and leisure travelers on weekends.

Key Insight: Occasion-based segmentation focuses on the purchase trigger rather than the customer profile. It answers the question, "When and why are they buying right now?" This allows for real-time marketing that can capture immediate intent.

Actionable Tips for Implementation

  • Create an Occasion Map: Brainstorm and map out all the potential occasions, both common and unique, where customers might use your product or service.
  • Develop Contextual Messaging: Craft advertising copy, promotions, and creative assets that speak directly to the specific occasion. A "back-to-school" campaign should look and feel different from a "summer vacation" one.
  • Use Predictive Analytics: Leverage data to anticipate upcoming occasions. For instance, send an anniversary promotion to a customer who bought an engagement ring a year ago.
  • Bundle for the Moment: Create product bundles or packages tailored for specific events, like a "game day snack pack" or a "new home essentials kit," to increase the average order value.

Customer Segmentation Strategies Comparison

Segmentation Type🔄 Implementation Complexity⚡ Resource Requirements📊 Expected Outcomes💡 Ideal Use Cases⭐ Key Advantages
Demographic SegmentationLow - straightforward data gatheringLow - census & market researchBasic groupings by age, gender, income; easy targetingConsumer packaged goods, retail, financial servicesSimple, cost-effective, data easily available
Psychographic SegmentationHigh - deep qualitative researchHigh - surveys, interviews, analysisRich insights into motivations and valuesLuxury, lifestyle brands, automotive, travel, hospitalityDeeper customer understanding; emotional connections
Behavioral SegmentationMedium - requires robust trackingMedium to High - analytics toolsActionable, data-driven targeting based on behaviorE-commerce, SaaS, subscriptions, retailHighly measurable; tied to revenue and conversions
Geographic SegmentationLow - location-based dataLow to Medium - GIS, geofencingLocalized marketing; adapts to climate and cultureRetail chains, restaurants, real estate, tourismCost-effective; supports logistics and local adaptation
Firmographic SegmentationMedium - B2B company data collectionMedium - public & proprietary dataTargeted B2B marketing and account prioritizationB2B software, professional services, industrial equipmentFocused on company traits; supports account-based sales
Value-Based SegmentationHigh - requires sophisticated analyticsHigh - predictive modeling toolsMaximized ROI by focusing on high-value customersSubscription services, financial, luxury, B2BOptimizes resource allocation; improves profitability
Needs-Based SegmentationHigh - deep customer research neededHigh - interviews, ethnographyCustomer-centric product innovation and value offersProduct development, SaaS, healthcare, diverse marketsAligns offerings directly with customer needs
Technographic SegmentationMedium to High - tech usage trackingMedium to High - data toolsUnderstanding tech stack and digital maturityB2B SaaS, tech vendors, marketing agencies, IT servicesPrecise targeting for tech compatibility and adoption
Generational SegmentationLow - based on birth cohortsLow - demographic dataCultural and behavioral targeting by generationConsumer goods, media, education, financial servicesCaptures cultural context; guides communication styles
Occasion-Based SegmentationMedium - requires timing & context insightMedium - predictive analyticsTimely, context-relevant marketing; increased frequencyRetail, hospitality, restaurants, event-driven productsSupports seasonal/event campaigns; enhances relevance
Free Tool

Try our Lookalike Company Finder — find companies similar to your best customers in seconds. No signup required.

From Strategy to Action: Implementing Your Segmentation Plan

We’ve explored a comprehensive roundup of the most effective customer segmentation strategies available today, from the foundational demographic and geographic models to the more nuanced behavioral, psychographic, and value-based approaches. Each strategy offers a unique lens through which to view your customer base, providing the clarity needed to move beyond generic, one-size-fits-all marketing.

The core takeaway is this: customer segmentation is not about choosing a single, perfect model. Instead, the most powerful and profitable strategies emerge from the intelligent combination of multiple approaches. True market leadership is achieved not by just knowing about demographic or behavioral segmentation, but by layering them to create a multi-dimensional, actionable customer persona. For example, a B2B company might start with firmographic data (company size, industry) and then layer on technographic insights (what CRM they use) and behavioral signals (which C-level executives engaged with a recent webinar) to identify its most qualified leads.

Synthesizing Your Segmentation Approach

The journey from understanding these strategies to implementing them requires a clear, goal-oriented plan. Simply collecting data is not enough; the value lies in its strategic application. Ask yourself: what business outcome are we trying to achieve? Is it to reduce churn, increase customer lifetime value, or break into a new market? Your answer will determine which segmentation model serves as your foundation.

  • For Boosting Retention: Start with Behavioral Segmentation. Identify at-risk customers based on declining engagement, product usage, or purchase frequency. Then, layer in Value-Based Segmentation to prioritize your efforts on retaining your most profitable customers first.
  • For Acquiring High-Value Customers: Begin with Psychographic and Needs-Based Segmentation. Understand the core motivations, pain points, and desired outcomes of your ideal customer profile. Use this to craft resonant messaging that speaks directly to their aspirations, rather than just their demographic profile.
  • For Driving Cross-Sells and Upsells: A combination of Behavioral and Value-Based Segmentation is key. Analyze past purchase history to identify customers who have bought complementary products before. From there, you can build predictive models to target similar segments with personalized offers.

Putting Your Plan into Action: A Quick Guide

Transitioning from theory to practice can feel daunting, but it can be broken down into manageable steps. The key is to embrace an iterative process of testing, learning, and refining. Segmentation is not a static, "set it and forget it" project.

  1. Define Clear, Measurable Goals: What does success look like? Be specific. "Increase conversion rates for our premium tier by 15% in Q3" is a much stronger goal than "get more customers."
  2. Gather and Consolidate Your Data: Pull information from your CRM, analytics platforms, customer surveys, and sales team feedback. Centralize this data to get a single, unified view of your customer.
  3. Choose Your Primary and Secondary Models: Select a primary segmentation model that aligns directly with your goal. Then, choose one or two secondary models to add depth and precision.
  4. Develop Segment-Specific Campaigns: Create tailored messaging, offers, and content for each of your top 2-3 priority segments. Don't try to target everyone at once.
  5. Test, Measure, and Iterate: Launch your campaigns and closely monitor the results. Use performance data to validate your segments and refine your approach. Did your "high-value, tech-savvy" segment respond as expected? If not, why? Use these insights to continuously improve your customer segmentation strategies.

By moving from abstract knowledge to concrete action, you transform customer data from a passive repository of information into a dynamic engine for sustainable growth. This strategic focus is what separates market leaders from the rest, allowing you to build deeper relationships, deliver exceptional value, and ultimately drive superior business results.


Ready to move beyond manual analysis and unlock the full potential of your customer data? marketbetter.ai uses advanced AI to automate the entire segmentation process, from identifying your most valuable customer groups to launching personalized campaigns at scale. Turn insight into action and see measurable results faster by visiting marketbetter.ai to learn more.

Multi-Touch Attribution Models Explained: Which One Matches Your Sales Cycle? [2026]

· 20 min read

Let’s be honest—your marketing data is probably lying to you.

It's not malicious, but if you're only looking at the last click before a sale, you’re missing 90% of the story. This is where multi-touch attribution comes in. Instead of giving all the credit to one single interaction, it spreads the credit across the entire series of touchpoints that led a customer to convert.

Think of it as the difference between crediting only the final goal-scorer in a soccer match versus acknowledging the assists, the passes, and the defensive plays that made the goal possible.

Why Your Marketing Data Is Lying to You

A chart showing various marketing channels and data points connected to a central goal, illustrating the complexity of the modern customer journey.

The modern customer journey is a maze, not a straight line. Someone might see your ad on Instagram, read a blog post a week later, click an email link, and finally convert through a branded Google search.

If you only credit that final search click, your data is telling you to pour all your money into search ads. In reality, Instagram and your blog did the heavy lifting to build awareness and trust. This is the massive blind spot created by single-touch models like last-click or first-click attribution. They’re simple, but they’re wrong.

Before you can fix the problem, you have to admit you have one. This means understanding why your old methods might be flawed, especially if you’re trying to accurately calculate marketing ROI.

The Shift Toward a Complete Picture

Relying on a single touchpoint is like giving all the credit for a championship win to the person who scored the final point. It completely ignores the teamwork and strategy that set up the opportunity. Smart businesses are catching on and moving away from these outdated methods fast.

Multi-touch attribution gives you a far more honest and complete view of the customer journey. It helps you see how different channels work together, so you can finally put your budget where it will actually make a difference.

This isn't just some passing trend; it's a strategic necessity. The multi-touch attribution market, already valued at USD 2.43 billion, is on track to hit USD 4.61 billion by 2030. With over 68% of enterprises already on board, the message is loud and clear: if you don’t understand the full journey, you’re flying blind.

By embracing multi-touch attribution models, you unlock a few key advantages:

  • Identify Hidden Influencers: You can finally see which channels are the unsung heroes of your funnel—the ones assisting conversions even if they don’t get the final click.
  • Optimize Budget Allocation: Stop guessing and start investing confidently in the channels that deliver real value across the entire customer journey.
  • Understand Customer Behavior: Get a true, ground-level view of how people actually interact with your brand before they decide to buy.

Decoding the Core Attribution Models

Once you stop giving 100% of the credit to a single click, you need a system to figure out how that credit gets divided. This is where rule-based multi-touch attribution models come into play. Think of them as different playbooks for assigning value across the entire customer journey.

Each model follows a specific, pre-set logic. To see how they work, let's follow a customer buying a new pair of sneakers:

  1. Touchpoint 1: Sees an ad on Instagram (First Touch).
  2. Touchpoint 2: Clicks a link in an email newsletter.
  3. Touchpoint 3: Reads a blog post about the "Top 5 Running Shoes."
  4. Touchpoint 4: Clicks a branded Google Search ad (Last Touch) and makes the purchase.

Now, let's see how different models would score this exact journey. If you're looking for a deeper dive into the fundamental concepts, this guide on What is Marketing Attribution is a great place to start.

The Linear Model: Equal Credit for All

The Linear model is the simplest and most democratic of the bunch. It’s straightforward: it splits the credit equally among every single touchpoint that played a part in the sale. No favorites, no fuss.

In our sneaker example, the conversion credit would be divided evenly:

  • Instagram Ad: 25%
  • Email Newsletter: 25%
  • Blog Post: 25%
  • Google Search Ad: 25%

Comparison: Unlike a last-click model which would give 100% credit to the Google Search Ad, the Linear model ensures the Instagram ad and blog post are recognized for their role. It's a great starting point for seeing the whole picture.

Actionable Tip: Use the Linear model if you have a long sales cycle and believe every interaction contributes to the final decision. It prevents you from mistakenly cutting the budget for top-of-funnel channels that don't get the final click.

The Time-Decay Model: Credit Where It’s Most Recent

The Time-Decay model works on a simple premise: the closer an interaction is to the sale, the more influential it was. The touchpoints nearest the finish line get the most credit, while earlier touches get progressively less.

For our sneaker purchase, the credit might look something like this:

  • Instagram Ad: 10%
  • Email Newsletter: 20%
  • Blog Post: 30%
  • Google Search Ad: 40%

Comparison: This model is the direct opposite of a first-click approach. It heavily favors closing channels over awareness channels. Compared to the Linear model, it provides a more weighted view based on timing.

Actionable Tip: This model is killer for shorter sales cycles or promotion-driven campaigns, like a weekend flash sale. It gives you a clear signal on which channels are most effective at closing deals, helping you decide where to double down for immediate results.

This infographic breaks down some of the most common multi-touch attribution models, including the ones we've just covered.

Infographic about multi-touch attribution models

As you can see, each framework prioritizes certain stages of the customer journey, which is why picking the right one is so critical.

Position-Based Models: U-Shaped and W-Shaped

Position-based models are all about giving the most weight to specific milestone touchpoints. The two most common variations are the U-Shaped and W-Shaped models.

The U-Shaped model (also called Position-Based) emphasizes the very beginning and the very end of the journey. It assigns 40% of the credit to the first touch, another 40% to the last touch, and sprinkles the remaining 20% across all the interactions in between.

In our sneaker example, the U-Shaped model would assign credit like this:

  • Instagram Ad (First Touch): 40%
  • Email & Blog (Middle Touches): 10% each
  • Google Search Ad (Last Touch): 40%

The W-Shaped model takes this a step further by introducing a third major milestone: the moment a person becomes a qualified lead (like signing up for a demo).

This model typically assigns 30% credit to the first touch, 30% to the lead-creation touch, and 30% to the final conversion touch. The last 10% gets split among the rest. It’s an ideal fit for B2B companies with very distinct, measurable funnel stages.

Comparing Rule-Based Multi-Touch Attribution Models

Choosing a model isn't just a technical decision; it reflects what you value most in your marketing strategy. Do you care more about what starts the conversation, what closes the deal, or the entire journey? This table breaks down the core rule-based models to help you see the differences at a glance.

ModelHow Credit Is AssignedBest ForActionable Insight
LinearCredit is split equally across all touchpoints.Long sales cycles and brand awareness campaigns.Reveals the full path, preventing you from cutting mid-funnel content.
Time-DecayTouchpoints closer to the conversion get more credit.Short, promotion-driven sales cycles.Identifies your strongest "closing" channels for quick wins.
U-Shaped40% to first touch, 40% to last touch, 20% to the middle.Valuing both lead generation and conversion equally.Helps you balance budget between top-of-funnel and bottom-of-funnel tactics.
W-Shaped30% each to first, lead creation, and last touch; 10% to others.B2B marketing with a clear lead qualification stage.Shows which channels are best at creating MQLs, not just initial clicks.

Ultimately, the right model provides actionable insights that align with your business goals. Whether you need to understand top-of-funnel impact or what’s pushing customers over the finish line, there’s a framework that can bring clarity to your data.

Stepping into Data-Driven Attribution

A person interacting with an abstract, glowing interface of data points and machine learning algorithms, symbolizing data-driven attribution.

While the rule-based models we've covered bring some much-needed order to the chaos, they all share a fundamental flaw: they're based on our assumptions. You're the one telling the system what's important—the first touch, the last click, or an even split.

But what if you could take the guesswork out of the equation entirely? What if the data itself could tell you which touchpoints were actually doing the heavy lifting?

That’s the promise of data-driven attribution, often called algorithmic attribution. It’s a massive leap forward from fixed rules to intelligent, adaptive measurement. Think of it as the difference between following a static, pre-written script and having a smart assistant that learns and adjusts from every single customer interaction.

Instead of force-fitting your data into a rigid formula, data-driven models use machine learning to analyze the unique, messy, and complex paths your customers take. The algorithm sifts through thousands of journeys—both those that end in a sale and those that don't—to spot the real patterns. It then assigns credit based on the actual, measured impact each channel has on the final decision.

The Algorithmic Advantage

The single biggest benefit here is accuracy. Period. You move beyond educated guesses and get a custom model built specifically around how your customers behave on your site.

This approach is brilliant at uncovering the true value of those middle-of-the-funnel touchpoints—the ones that play a subtle but critical role in nurturing a lead but rarely get the final credit.

By comparing successful conversion paths against unsuccessful ones, a data-driven model can calculate the real probability of a conversion at each step. This allows for a much more nuanced and accurate distribution of credit than any rule-based system could ever hope to achieve.

Getting this right is becoming non-negotiable. The market is shifting toward advanced AI models that can analyze millions of data points to deliver this kind of insight. For companies that get it right, the payoff is huge—often boosting marketing ROI by 25-40%.

What You Need to Make It Work

Data-driven attribution is powerful, but it’s not a magic wand you can wave over a sparse dataset. Its effectiveness is completely dependent on the quality and, more importantly, the volume of data you feed it.

Before you jump in, you need to be honest about a few things:

  • Data Volume: To get statistically significant results, you need a lot of data. We're talking thousands of conversions and tens of thousands of unique user paths every single month. Without that, the algorithm is just guessing.
  • Technical Chops: A true data-driven model isn't a simple toggle in your analytics tool. It often requires specialized platforms or an in-house team that can manage the complexity.
  • Data Hygiene: The model is only as good as the information it’s fed. Clean, consistent tracking across every single channel is an absolute prerequisite. For a deeper dive into the tech behind this, our guide on person-level identification breaks down how individual journeys are tracked.

If your business has lower conversion volumes or you're just starting out, sticking with a solid rule-based model like Linear or U-Shaped is a perfectly smart and practical first step. But for any organization sitting on a mountain of good data, making the move to a data-driven model is like turning on the lights in a dark room.

Your Action Plan for Choosing the Right Model

Alright, let's get out of the textbook and into the real world. Figuring out which attribution model to use isn't some academic exercise—it's about picking the right tool for the job.

The perfect model for a fast-moving e-commerce brand is going to be completely wrong for a B2B SaaS company with a six-month sales cycle. It's that simple.

Making the right call means taking an honest look at your goals, how your customers actually behave, and what resources you have on hand. Let's walk through a few questions to get you pointed in the right direction.

Your Decision-Making Framework

Your business isn't a generic template, so your attribution model shouldn't be either. Think of these questions as a filter to help you match what your business needs with what each model does best.

1. How Long Is Your Sales Cycle?

This is the big one. The time it takes for someone to go from "who are you?" to "take my money" changes everything.

  • Short Sales Cycle (days to weeks): If customers make decisions fast, the touchpoints right before the sale are usually the most important. The Time-Decay model is built for this. It gives more credit to the last few interactions that got the customer across the finish line. Think about a weekend flash sale—you want to know which last-minute email or retargeting ad sealed the deal.

  • Long Sales Cycle (months to a year): When the journey is a marathon, not a sprint, every touchpoint plays a role. The Linear model is your friend here. It gives equal credit to every interaction, making sure you don't accidentally kill the budget for that blog post that introduced a customer to your brand six months before they finally converted. It prevents short-term thinking.

2. What Are Your Primary Business Goals?

What are you actually trying to accomplish right now? Growing your email list? Driving brand awareness?

Your model has to line up with your strategy. If you're all-in on lead generation, a U-Shaped model makes sense—it credits both the first touch (the lead) and the last touch (the conversion). But if you're running a huge brand awareness campaign, a Linear model might be better to value every single impression and click along the way.

3. How Complex Is Your Customer Journey?

Next, map out how many channels and steps are usually involved before someone buys from you.

  • Simple Journey (a few touchpoints): If your path to purchase is pretty direct—say, a social ad straight to a product page—a U-Shaped model is a fantastic place to start. It gives props to what started the journey and what closed it, which is often all the signal you need.

  • Complex Journey (many touchpoints and clear stages): For businesses with a more defined funnel, like most B2B companies, a W-Shaped or Full-Path model is a much better fit. These models let you assign major credit to those key moments in the middle of the funnel, like when a lead becomes marketing-qualified (MQL) or books a demo.

4. What Are Your Available Resources?

Let’s be real about your data and your team's technical skills.

If you have a massive amount of conversion data (thousands per month) and a data science team on standby, then a Data-Driven model is the holy grail. It ditches the guesswork and builds a custom algorithm based on what your actual customers are doing.

But for most businesses, that's overkill. You can get 90% of the value with only 10% of the complexity by starting with a well-chosen, rules-based model. Don't let the hunt for perfection stop you from making solid progress today.

Your Action Plan for Implementation

An attribution model is only as good as its implementation. Moving from theory to practice requires a clear, actionable roadmap. You need to make sure your data is clean, your goals are defined, and your team is on the same page. This plan will get you from initial setup to analyzing your first results.

A successful rollout isn't just a technical task; it's a strategic one. Careful planning is the only way to avoid common pitfalls like incomplete tracking or picking a tool that can't grow with you.

Define Your Key Conversion Events

Before you can track anything, you have to decide what a "win" actually looks like. Is your main goal a completed purchase? A demo request? A newsletter signup?

Be specific and prioritize. A B2B company might map out its key conversion events like this:

  • Micro-conversion: Whitepaper download
  • Macro-conversion: Demo request submitted
  • Sales conversion: Deal closed-won in the CRM

Defining these events ensures your multi-touch attribution models measure what truly matters to the business. You get actionable insights, not just vanity metrics.

Ensure Clean and Comprehensive Data Collection

Your attribution system is completely dependent on the data you feed it. Inaccurate or incomplete data will lead to flawed conclusions, no matter which model you choose. The principle is simple: garbage in, garbage out.

To keep your data clean, focus on two core areas:

  1. Consistent UTM Tagging: Implement a standardized UTM structure across all your campaigns. This is the only way to accurately track the source, medium, and campaign for every single click, ensuring no touchpoints are miscategorized.
  2. Robust Tracking Pixels: Double-check that your tracking pixels (like those for Google or Meta) are correctly installed on every relevant page. This is non-negotiable for capturing user interactions and building a complete picture of the customer journey.

Here's an example from Google's documentation showing how a data collection tag is implemented.

Screenshot from https://developers.google.com/analytics/devguides/collection/ga4/tag-guide

This little code snippet is the foundation of your data collection. It has to be implemented correctly for every touchpoint to be captured accurately.

Select the Right Attribution Tool

Choosing the right software is a make-or-break step. The global marketing attribution software market is projected to grow at a CAGR of 13.6% from 2025 to 2030, all because companies need to make sense of fragmented digital journeys. The right tool should fit what you need today while having the horsepower to grow with you tomorrow.

A common mistake is picking a tool that's either too simplistic for your needs or way too complex for your team to manage. Your choice should line up with your data volume, technical resources, and business goals.

Analyze, Iterate, and Get Buy-In

Once your system is live and data is flowing, the real work begins. Your first batch of reports won't be the final word; they're your new baseline for understanding performance. Share these initial findings with other teams—especially sales and IT—to get their buy-in and different perspectives. Collaboration is what makes everyone trust the data.

The insights from your attribution model should directly inform your strategy. You can use this data to fine-tune other marketing processes, too. For instance, you might check out our guide on AI-powered lead scoring to see how attribution data can help you prioritize your most valuable leads. The goal is to create a continuous loop: analyze, act, and improve.

Free Tool

Try our Marketing Plan Generator — generate a complete AI-powered marketing plan in minutes. No signup required.

Answering Your Top Attribution Questions

You've got the concepts down, but let's be real—moving to a new way of measuring marketing always brings up some practical questions. We get it. Here are some straight, no-fluff answers to the things marketers usually ask when they're ready to see the whole picture.

What Is the Main Difference Between Single-Touch and Multi-Touch Attribution?

Think of it like a soccer game.

Single-touch attribution is like giving 100% of the credit to the player who scored the final goal. The first-touch model gives it to the first player who touched the ball, and the last-touch model gives it to the final scorer. It’s simple, but you completely miss the assists and defensive plays that made the goal possible.

Multi-touch attribution, on the other hand, is like watching the game replay. It distributes credit across all the players who passed the ball, created the opening, and set up the final shot. You get a far more realistic view of how the entire team—your entire marketing mix—worked together to score.

How Much Data Do I Need for a Data-Driven Attribution Model?

This is a big one. Data-driven models are powerful, but they're also data-hungry. Because they rely on algorithms to find patterns, they need a ton of information to produce anything reliable.

There isn't a perfect magic number, but a good rule of thumb is you'll need thousands of conversions and tens of thousands of individual touchpoints every single month. If you're not at that scale, the model's conclusions can be shaky.

Don't have enterprise-level data volume? No problem. That's exactly why rule-based models like Linear or U-Shaped exist. They offer a huge step up from single-touch and give you actionable insights without needing a massive dataset.

For teams with higher data volumes, our case studies on attribution show just how powerful a data-driven approach can be for uncovering hidden channel value.

Can I Use Multi-Touch Attribution Without an Expensive Tool?

Absolutely. You don't need to jump straight to a pricey, dedicated platform, but be prepared for some manual work.

You can actually start with tools you probably already have. Google Analytics, for instance, has built-in multi-touch reports that let you compare different models right out of the box. It’s a great way to dip your toes in the water.

For a more custom setup, you can export your data to a BI tool and build your own models. The main trade-off is time and effort. Dedicated attribution software automates all the messy data collection and number-crunching, which saves a ton of hours, cuts down on human error, and gets you clearer answers, faster.


Ready to stop guessing and start seeing the full picture of your marketing performance? marketbetter.ai provides an integrated AI platform that simplifies multi-touch attribution, helping you optimize your budget and prove your ROI with confidence. Discover how our platform can transform your marketing analytics.

Predictive Analytics in Marketing: How Top B2B Teams Forecast Revenue (Not Just Leads) [2026]

· 23 min read

For years, marketing felt like driving down a highway while only looking in the rearview mirror. We’d pour over last quarter's campaign data, trying to figure out what worked yesterday. It’s a purely reactive game—like trying to steer a ship by watching its wake. Sure, it tells you where you’ve been, but it offers zero help with what’s coming up ahead.

Predictive marketing completely flips the script.

Think of it as having a real-time GPS with live traffic updates. Instead of just looking back, you’re now using data to see the road ahead. Predictive analytics in marketing doesn't just report on what happened; it forecasts what your customers are likely to do next. That shift from guesswork to informed strategy is a massive competitive advantage.

From Reactive to Proactive Strategies

The real change is in the questions we can finally ask. A traditional marketer asks, "Which customers bought our product last quarter?" But a predictive marketer asks, "Which customers are most likely to buy our product next week?"

This proactive mindset transforms how marketing gets done:

  • Audience Targeting: Forget casting a wide net with broad demographics. Now you can pinpoint the actual individuals with the highest probability of converting.
  • Customer Retention: Instead of finding out about churn after it’s too late, you can identify customers who are at risk of leaving and step in with the right offer to keep them.
  • Budget Allocation: You can put your marketing dollars into the channels that are forecasted to deliver the best ROI, before you even spend them.

Predictive analytics doesn't just tweak marketing—it redefines the entire goal. The objective is no longer just to reach a big audience. It’s about engaging the right person at the exact moment they’re ready to listen.

The New Standard for Modern Marketing

This kind of tech used to be locked away in the ivory towers of massive companies with teams of data scientists. Not anymore. The rise of more accessible AI and machine learning has put these tools in the hands of businesses of all sizes.

Now, you can use predictive models to optimize everything from a simple email subject line to a complex, multi-channel customer journey. Understanding how this powers modern tactics like data-driven content marketing is the key to seeing why it’s no longer optional. It delivers a level of personalization and raw efficiency that was pure science fiction just a decade ago, making it an essential part of any serious marketing strategy today.

How Predictive Analytics Actually Works

A marketer analyzing complex data charts on a computer screen.

Predictive analytics might have a futuristic ring to it, but the concept is surprisingly straightforward. Think of it like a master chef who knows exactly which ingredients to combine to get the perfect dish every single time. It's about looking at what you have (your data) to create a recipe for what's coming next (an accurate prediction).

This isn't just about reporting on past performance. It’s about forecasting the future.

This forward-looking magic is powered by machine learning algorithms. These algorithms are built to dig through mountains of historical data, finding the subtle patterns and hidden connections a human would miss. That’s the real secret sauce of predictive analytics in marketing—it spots the quiet signals that come right before a customer makes a move.

But here’s the catch: the whole thing falls apart without the right data. The quality and variety of the information you feed the system determines everything. You can't cook a gourmet meal with bad ingredients.

The Key Ingredients: Your Data

To make accurate predictions, these models need a rich diet of different data types. Each one adds another layer to the customer's story, giving the algorithm a much clearer picture to analyze.

The main data sources are:

  • Behavioral Data: This is all about what your customers do. Think website clicks, pages they linger on, emails they open, and content they download. It’s your direct line into their interests and engagement level.
  • Transactional Data: This covers what your customers buy. Purchase history, how often they order, average cart size, and returns—all of it reveals their buying habits and what they value.
  • Demographic Data: This is who your customers are. Age, location, job title, or company size for B2B. This data helps build the foundational segments you'll work from.

To really get how these models work, you have to start by understanding intent data, which is all about spotting the online behaviors that signal someone is ready to buy.

By blending these sources, you build a complete customer profile. The algorithm then finds the money-making correlations—like noticing that customers who view a specific product page three times are 85% more likely to buy in the next 48 hours.

Turning Data Into Actionable Predictions

Once the data is wrangled, the algorithms get to work building predictive models. These aren't generic, one-size-fits-all tools. They’re highly specialized, each trained to answer a specific marketing question.

Here are three of the most common predictive models you'll see in marketing:

Predictive ModelWhat It PredictsKey Business Question It Answers
Predictive Lead ScoringThe odds that a new lead will actually become a paying customer."Which leads should my sales team call right now?"
Customer Churn PredictionThe probability that a current customer is about to leave."Who is at risk of churning, and what can we do to save them?"
Customer Lifetime Value (CLV)The total revenue you can expect from a customer over their entire relationship with you."Who are our VIPs, and how do we find more people just like them?"

Each model spits out a clear, actionable score. A lead gets a 95 (hot) or a 20 (cold). A customer is given an 80% churn risk. This simple output shifts a marketing team from just reporting on the past to proactively shaping the future. If you want to see how these individual data points are woven together, our guide on person-level identification dives deep into the more advanced techniques.

This ability to see around the corner is why the AI in marketing industry is set to hit $107.5 billion by 2028. It’s the engine behind the hyper-personalized experiences that customers don't just want anymore—they expect.

Predictive Marketing vs. Traditional Marketing

For decades, marketing ran on a familiar playbook. It was a craft built on historical data, broad demographic segments, and a healthy dose of professional gut feeling.

Think of the traditional marketer as an archaeologist. They spend their time carefully digging through past campaign results to figure out what worked yesterday. It’s a method that relies entirely on looking backward.

Predictive marketing, on the other hand, is more like being an astronomer with a powerful telescope. Instead of digging in the dirt, you're charting the stars to forecast future movements. Predictive analytics in marketing doesn't just analyze what happened; it uses that data to calculate what’s most likely to happen next. This single shift flips the entire discipline from reactive to proactive.

This is a fundamental change that impacts everything, from how you see your audience to how you spend your budget.

The Audience Building Shift

In traditional marketing, we built audiences using static, broad buckets. A classic approach was grouping people by demographics—think age, location, or job title. It's like sorting your music library by genre. Sure, it’s organized, but it tells you nothing about what someone actually wants to listen to right now.

Predictive marketing builds dynamic clusters based on behavior. It identifies customers not by who they are, but by what their actions suggest they will do. A predictive model might create a segment of "customers showing a 90% probability of buying a specific product in the next 7 days," completely independent of their demographics. That’s a far more precise and actionable way to target.

From Blasts to Personalized Journeys

Campaign execution is another area where the contrast is stark. The old way involved broad message blasts sent to those static segments. It was a one-to-many approach that just hoped the message resonated with enough people to scrape by with a positive return.

A predictive approach makes one-to-one personalized journeys possible at scale. Instead of a generic seasonal promo sent to everyone, a predictive campaign identifies an individual customer as a high churn risk and automatically sends them a personalized "we miss you" offer. The message, timing, and discount are all determined by their forecasted behavior.

The infographic below gives you a sense of the complex data modern analytics tools are crunching to make these kinds of sophisticated strategies a reality.

Infographic about predictive analytics in marketing

This kind of synthesis is what allows marketers to move beyond simple reporting and into true forecasting.

Forecasting ROI Instead of Just Reporting It

Perhaps the biggest advantage is how you measure results. Traditional ROI analysis is almost always a look in the rearview mirror. You run a campaign, wait for the dust to settle, and then report on what happened.

With predictive marketing, you can run pre-campaign forecasting. Models can estimate the potential conversion rates and revenue lift of different campaign strategies before you spend a single dollar. This leads to much smarter budget allocation and takes a significant amount of risk out of your marketing spend.

The core difference is simple: Traditional marketing reports on the past. Predictive marketing provides a roadmap for the future.

The market is catching on fast. By 2025, over 55% of businesses globally are expected to be using AI-powered predictive analytics to sharpen their decision-making. The global predictive analytics market is projected to rocket from $9.5 billion in 2022 to $41.2 billion by 2030, a testament to its massive growth and impact. You can dig into more research on the expansion of predictive analytics statistics to see its trajectory.

To make this crystal clear, here’s a side-by-side view of the old playbook versus the new one.

Predictive Analytics vs Traditional Marketing Approaches

This table breaks down the core differences, showing how a proactive, data-driven approach changes the game across key marketing functions.

Marketing FunctionTraditional Approach (Reactive)Predictive Analytics Approach (Proactive)
Audience BuildingStatic, demographic-based segments (e.g., "males, 25-34").Dynamic, behavior-based clusters (e.g., "users likely to convert").
Campaign ExecutionBroad, one-to-many message blasts.Personalized, one-to-one customer journeys.
ROI AnalysisAfter-the-fact reporting on past performance.Pre-campaign forecasting to predict outcomes.
PersonalizationBased on basic attributes like name or location.Based on predicted intent and future needs.
Primary GoalReach a wide audience and analyze what happened.Engage the right individual at the right time and shape what happens next.

The takeaway is straightforward: while traditional methods focus on what has already occurred, predictive analytics gives marketers the tools to anticipate and influence what will happen next.

Predictive Analytics in Action: Real-World Examples

Theory is one thing, but seeing predictive analytics in marketing actually work is another. The funny thing is, you probably bump into predictive models every single day without even realizing it. These aren’t just abstract ideas cooked up in a lab; they’re the engines quietly running some of the most personalized experiences you have online.

From the next show you binge-watch to the price you pay for a ride home, predictive analytics is in the driver's seat. Let’s pull back the curtain on four powerful examples and see how this tech goes from a buzzword to a bottom-line booster.

The Netflix Effect: Hyper-Personalized Recommendations

Ever wonder how Netflix seems to know exactly what you want to watch next? It’s not a lucky guess—it’s a world-class predictive recommendation engine. The platform doesn’t just see what you’ve watched; it crunches thousands of data points to figure out what you’ll probably love in the future.

And this goes way beyond just matching genres. Netflix’s models are looking at everything:

  • Viewing Habits: What time you watch, how long you stick around, and even if you pause or re-watch a particular scene.
  • Device Information: Are you on a big-screen TV, a laptop, or your phone? That context matters.
  • User Interactions: Everything from your search queries and ratings to which movie poster artwork you’re most likely to click on.

By piecing all this together, the algorithm predicts your tastes with almost spooky accuracy. The business result is simple but powerful: a more addictive user experience that keeps people from canceling their subscriptions. A happy, engaged subscriber sticks around.

Proactive Churn Prevention in Telecommunications

The telecom world is notoriously cutthroat, and customer churn is the monster under the bed. For companies like Verizon or AT&T, every customer who walks away is a big financial hit. So instead of waiting for people to leave, they use predictive analytics to spot who’s getting restless before they switch carriers.

They do this by building a churn prediction model that looks for subtle signs of unhappiness. These might be a sudden drop in data usage, a spike in calls to customer support, or recent billing problems.

The model assigns a "churn risk score" to every single customer. Anyone with a high score gets automatically flagged. This lets the retention team jump in with a proactive, personalized offer—maybe a special discount or a data plan upgrade—to convince them to stay loyal.

This is a complete shift from the old, reactive "exit survey" model to a smart, proactive retention strategy. It directly plugs a hole in the revenue bucket, saving customers who would have otherwise been long gone. To see how companies translate these kinds of insights into real wins, check out some of the detailed marketing analytics case studies that show the before-and-after.

Dynamic Pricing for Airlines and Ride-Sharing

If you’ve ever booked a flight or hailed an Uber during rush hour, you’ve been on the receiving end of predictive pricing. Airlines and ride-sharing apps don't just set a price and forget it; they use sophisticated models to adjust fares in real-time based on what they think demand will be.

These dynamic pricing models are constantly swallowing a stream of data to make their next move:

  • Historical booking patterns for a specific route.
  • Current search volume and website traffic.
  • External factors like the weather, local events, or upcoming holidays.
  • What the competition is charging right now.

With these inputs, the algorithm predicts what's coming. If it expects a huge surge in ride requests when a concert lets out, prices automatically go up. If it sees that a Tuesday morning flight is looking empty, fares drop to fill those seats. This whole strategy is about maximizing revenue by making sure the price is always perfectly matched to the predicted demand.

Smart Budget Allocation for E-Commerce Brands

For any e-commerce brand, the question of where to spend the next advertising dollar is a million-dollar one. Predictive models help take the guesswork out of it by forecasting the potential return on investment (ROI) from every marketing channel.

Instead of just looking at the last click before a sale, these models analyze the entire customer journey. They predict which channels are most likely to bring in high-value customers. For instance, a model might reveal that while social media ads get a ton of initial clicks, email marketing is 75% more likely to convert a big spender for a specific product line.

Armed with that kind of foresight, marketing teams can confidently shift their ad spend away from channels that aren't pulling their weight and double down on the ones with the highest forecasted ROI. This makes sure every dollar in the marketing budget is working as hard as it possibly can.

Your Five-Step Predictive Analytics Implementation Plan

A professional team collaborating on a predictive analytics implementation plan in a modern office.

Jumping into predictive marketing can feel like you’re trying to boil the ocean. It’s a huge concept. But you don't have to. The best way to get started is by breaking it down into a clear, step-by-step roadmap that builds a real predictive engine for your business.

This isn’t about flipping a switch and hoping for the best. It's a methodical process. And it doesn't start with algorithms or fancy tech—it starts with a simple, focused question about what you're trying to fix.

Let's walk through the five stages to make it happen.

Step 1: Pinpoint Your Core Business Objective

Before you look at a single data point, you need to know what you’re aiming for. A fuzzy goal like "improve marketing" is useless. You need a specific, measurable target that a predictive model can actually be trained to hit.

Start with a real pain point. Are you losing customers and you don't know why? Is your cost to acquire a new customer getting out of control? Are you leaving money on the table because one-time buyers never come back?

Frame that problem as a sharp, clear goal:

  • Reduce customer churn by 15% in the next six months.
  • Increase the conversion rate of new leads by 20% this quarter.
  • Boost customer lifetime value (CLV) by 25% over the next year.

This clarity is everything. Your objective is your North Star. It guides every decision you make from here on out and ensures all this work actually connects to real business value.

Step 2: Unify and Prepare Your Data

Your predictions are only ever as good as the data you feed them. To find meaningful patterns, predictive models need clean, consolidated, and complete data. The problem? For most companies, customer data is a mess, scattered across a dozen disconnected silos—your CRM, e-commerce platform, email tools, web analytics, you name it.

The mission here is to create a single customer view. This is a unified profile that stitches together every single touchpoint and interaction a person has with your brand. It’s non-negotiable. Fragmented data leads to half-baked analysis and, worse, flat-out wrong predictions.

This means you have to invest time in a data audit and cleanup. Standardize formats, zap duplicate entries, and make sure your historical data is accurate. It’s the least glamorous part of the process, but it’s the absolute bedrock of your success.

Step 3: Select the Right Tools for Your Team

Okay, you have a clear goal and clean data. Now it's time to pick your tech. The market for predictive analytics in marketing has exploded, with options for teams of all sizes and skill levels. You basically have two paths you can go down.

This table should help you figure out which approach fits your company best.

Tooling ApproachBest ForKey AdvantagesPotential Drawbacks
User-Friendly PlatformsTeams without data scientists who need quick wins.Out-of-the-box models, easy-to-use interfaces, and fast setup.Less customizable; might not solve super-specific business problems.
Custom-Built ModelsBig companies with data science teams and unique needs.Highly tailored to your exact goals, giving you maximum control.Expensive, takes a long time to build, and requires specialized talent.

For most marketing teams, starting with a platform that has predictive features already built-in is the most practical move. It lets you prove the value of this approach without needing a massive upfront investment in hiring a data science team.

Step 4: Train and Validate Your Predictive Model

Once your tool is in place, it’s time to train your model. This is where you feed all your historical data into the algorithm so it can learn the patterns that lead to your goal. For instance, to build a lead scoring model, you'd give it data on all your past leads—the ones that converted and the ones that went cold.

The model chews through thousands of data points to find the signals that matter. It might learn, for example, that a lead who downloads a specific whitepaper and then visits your pricing page is 80% more likely to buy. Our guide on AI lead scoring goes deeper into how these models build a smarter sales pipeline.

After the initial training, you have to validate the model's accuracy. You do this by testing it on a fresh set of data it has never seen before. This step is critical—it confirms that your model's predictions are reliable and not just a lucky guess based on the training data.

Step 5: Weave Insights into Action

Here's the bottom line: a perfect prediction is completely worthless if you don't do anything with it. The final, most important step is wiring the model's output directly into your day-to-day marketing. This is how you turn foresight into automated, personalized campaigns that actually drive revenue.

For example:

  • A churn prediction model can automatically enroll at-risk customers into a "we miss you" email campaign.
  • A lead scoring model can instantly push your hottest leads to the top of the sales team's queue.
  • A CLV model can trigger exclusive offers designed to delight your most valuable customers.

This is what modern marketing looks like. Instead of just reacting to what already happened, you're proactively shaping what happens next. You’re moving from rearview-mirror reporting to dynamic forecasting. By putting your predictions to work, you close the loop and turn raw data into real, measurable growth.

Free Tool

Try our AI Lead Generator — find verified LinkedIn leads for any company instantly. No signup required.

Common Questions About Predictive Marketing

Let’s get real. Diving into predictive marketing brings up a ton of practical, "how does this actually work for me?" questions. It's one thing to talk about algorithms and another to figure out the people, data, and budget you actually need to pull it off.

So, let's cut through the noise and tackle the most common concerns marketers have. Think of this as the straight-talk guide to getting started.

Do I Need a Team of Data Scientists?

This is the big one. The myth that stops so many teams before they even start.

The short answer? No—not anymore.

Sure, big enterprise companies might have a whole team of PhDs building custom models from the ground up. But that's like building your own car engine just to get to the grocery store. It's no longer the only way to get there.

Today, a new wave of marketing platforms has incredibly powerful predictive features built right in. These tools are designed for marketers, not coders. They do all the heavy lifting behind the scenes and serve up the insights on a silver platter.

The goal isn't to become a data scientist. It's to become a marketer who can use the outputs of data science to make much, much smarter decisions.

So, what's the right path for you?

ApproachBest ForWhat It Looks Like in Practice
In-House Data Science TeamHuge enterprises with unique, complex problems and even bigger budgets.Building proprietary algorithms from scratch to predict hyper-specific customer behaviors.
User-Friendly AI PlatformsPretty much every other B2B and B2C marketing team looking for proven, scalable solutions.Using a tool with "out-of-the-box" features like predictive lead scoring or churn risk analysis.

For most businesses, the smartest move is to find your biggest marketing headache and pick a user-friendly tool that solves it.

What Kind of Data Do I Really Need?

Here’s the thing about predictive models: they're only as good as the clues you give them. Garbage in, garbage out. The good news is you probably already have most of the data you need sitting right under your nose.

The trick is getting it all in one place. To start, you need a solid foundation of historical data, which usually breaks down into three buckets:

  • Transactional Data: All the "what" and "when." Purchase history, average order value, product categories, and subscription dates. This is the story of what your customers buy.
  • Behavioral Data: The "how." Website visits, email clicks, content downloads, app usage, and support tickets. This stuff reveals how customers actually engage with you.
  • Customer Data: The "who." Demographics, firmographics, location, job titles, company size, and how they found you in the first place. This adds critical context.

If you do one thing first, make it this: break down your data silos. Get everything flowing into a central hub, like your CRM or a Customer Data Platform (CDP). If your data is a scattered, messy disaster, your first and most important project is a data cleanup. Without that single source of truth, your predictions will never be reliable.

How Can I Measure the ROI of Predictive Analytics?

Proving the value of a new investment is always job number one for marketers. Thankfully, the impact of predictive analytics isn't some fuzzy, abstract concept—it’s incredibly measurable. The key is to set a clear baseline before you start and then run a clean comparison.

Here are four simple ways to nail down your ROI:

  1. A/B Test Your Campaigns: This is the cleanest test. Send a predictive, hyper-personalized offer to one segment. Send a generic offer to a control group. The difference in the conversion rate is your lift. Simple as that.
  2. Track Customer Retention: Use your churn model to flag a group of at-risk customers. Proactively reach out to half of them with a retention offer. Do nothing for the other half. The difference in the churn rate between the two groups is pure, measurable ROI.
  3. Compare Customer Lifetime Value (CLV): Look at the CLV of customers you brought in through predictive targeting versus those who came from your old methods. A higher CLV in the predictive group shows you’re not just getting more customers—you’re getting better customers.
  4. Calculate Cost Per Acquisition (CPA): When you stop wasting ad spend on leads who were never going to convert, your CPA naturally drops. Track this metric before and after you roll out predictive lead scoring to see exactly how much you’re saving.

By setting these KPIs from day one, you’ll have no trouble connecting your predictive efforts directly to revenue gains and cost savings.


Ready to stop guessing and start predicting? marketbetter.ai integrates powerful AI across your entire marketing workflow, from content creation to campaign optimization. Our platform makes it easy to turn data into revenue without needing a team of data scientists. Discover how you can drive growth with actionable insights by exploring our solutions.