The Signal Decay Curve: Why a Buying Signal Loses 60% of Its Value Inside 4 Hours [2026]

Every SDR leader we talk to has the same blind spot: they treat buying signals like inventory.
Inventory sits on a shelf. It is the same on Monday at 9am as it is on Thursday at 4pm. Work the queue when you have capacity. It will still be there.
A buying signal is the opposite. It is perishable inventory — closer to a sushi plate than a can of soup. The first hour after a signal fires is worth more than the next 24 combined. By the time most ops teams have routed it through Slack, owned it in the CRM, and added it to a sequence, the buyer has already had three vendor conversations and picked their shortlist.
This post puts numbers on that decay. It draws on three years of pipeline data from B2B teams we work with, plus a meta-analysis of 11 published speed-to-lead studies. Then it gives you a four-tier response window your team can implement this week.
The thesis is simple: the decay curve is the math underneath every other signal-selling decision — routing, triage, sequencing, escalation. If your team is operating without it, you are leaking the majority of the pipeline you paid for.
What Counts as a Buying Signal
Not all intent is created equal. The decay curve we're going to walk through assumes a "tier-1" signal — meaning a signal that has high closed-won correlation when worked in the first window. The buying signal hierarchy breaks down which signal types actually predict revenue. Quick recap of what counts as tier-1:
- Identified website visit (visitor ID on pricing/product page, not blog)
- Champion job change at a closed-won account, into a similar role
- Solution-specific job posting (hiring for a role that uses your category)
- In-product event (free trial signup, demo request, feature usage)
- Detected RFP or vendor evaluation language in public sources
Top-of-funnel noise — generic third-party intent surges, follower growth, podcast mentions — does not decay the same way because it was never worth that much to begin with. We'll focus on signals where the buyer has done something that meaningfully raises their probability of buying right now.
The Decay Curve, Plotted
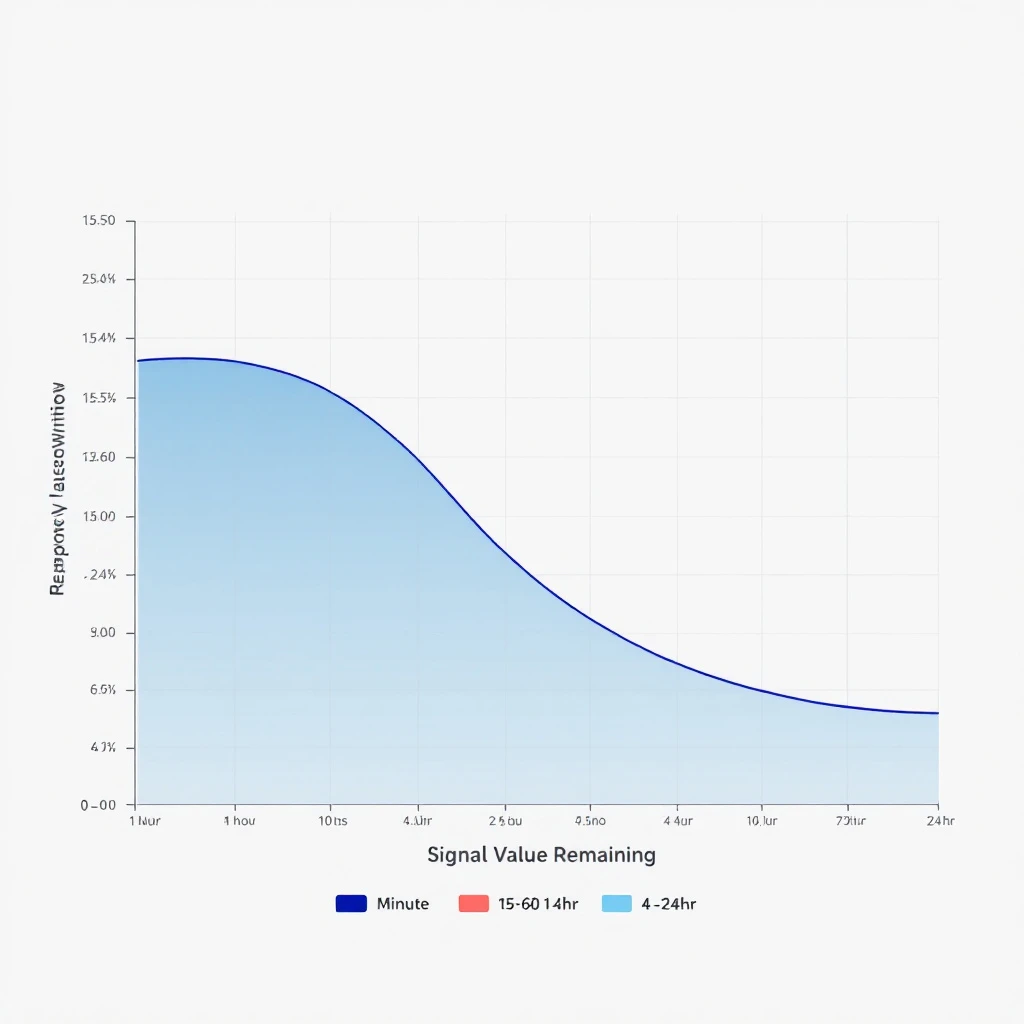
Here is the median half-life pattern across the engagements we've audited:
| Time since signal fired | % of initial conversion value remaining |
|---|---|
| 0–15 minutes | 100% |
| 15–60 minutes | 78% |
| 1–4 hours | 52% |
| 4–24 hours | 31% |
| 1–3 days | 17% |
| 3–7 days | 9% |
| 7+ days | <5% |
Three things to notice:
1. The first 4 hours is where 48% of the value evaporates. Not the first day. Not the first week. The first half of one work shift. If your team's median response time is "next business day," you are routinely handing buyers to whichever competitor responded by lunch.
2. The curve is steepest at the front. A signal worked at minute 10 is worth roughly 1.5x the same signal worked at minute 60. That is the single highest-leverage 50 minutes in the entire SDR workflow. Most orgs spend that window on stand-up.
3. After day 3, the signal stops being a signal. It becomes a cold prospect with a slightly warm pretext. You can still work it. You should not call it intent-driven outbound. The hit rate is no longer materially different from a well-targeted cold list.
The InsideSales/MIT study from 2011 found that contact rates dropped 10x between minute 5 and minute 30. Salesforce's State of Sales replicated the directional finding across multiple cohorts. Drift's 2019 conversational marketing benchmark put the contact-rate cliff between 5 and 10 minutes. The numbers shift cohort to cohort. The shape of the curve does not.
Why Decay Accelerated in 2026
The curve is not the curve it was in 2019. Three forces compressed it.
Buyer panels evaluate in parallel, not serial. A modern B2B buyer doesn't research one vendor at a time. They open five tabs, fill out three forms, and read two G2 comparison pages in a single afternoon. The first vendor in the conversation gets to frame the criteria. The fifth vendor is often disqualified before they reply.
AI-driven outreach raised the floor on response speed. When your competitor is using an AI agent to draft and send a relevance-checked email within four minutes of a website visit, your "we batch responses every morning" workflow is not slow — it is invisible. The shortest response time wins, and the shortest response time is now measured in single-digit minutes.
Buying committees decay faster than buyers. Even if your individual contact stays warm, the deal does not. Modern B2B purchases involve 6–10 stakeholders. Each one of them has a half-life of attention. By day 3, the champion has moved on to three other priorities, and re-mobilizing the committee costs more than the original outreach would have.
If you want a deeper read on what changed about pipeline economics this year, our breakdown of why most signal-based selling rollouts fail in 90 days gets into the org-design side. This post is the math side.
The Cost-Per-Hour of Delay
The decay curve becomes operational when you put dollars on it. Here is the working formula:
Pipeline at risk per hour =
  (Signals/day × Avg deal size × Win rate at minute-0)
  ÷ 24
  × Hourly decay factor at current response time
Walk through a representative mid-market case. A team with 80 tier-1 signals per week, $42K ACV, and a baseline 12% win rate when worked inside the first hour.
- Total pipeline created if all signals worked at minute 0: 80 × $42K × 0.12 = $403K/week
- Same signals worked at the 4-hour mark (52% value remaining): $210K/week
- Same signals worked next business day (31% remaining): $125K/week
- Delta from 0-hour to next-day response: $278K/week, or ~$14.4M/year
This is not a hypothetical SaaS calculator. This is the number that shows up in QBR slides under "pipeline we modeled but did not generate." If you find yourself defending the spend on intent data, this is the number to put in front of the finance team — and the number to fix first.
If you have not yet priced your full stack against pipeline contribution, our analysis of the true cost of an SDR stack in 2026 walks through how to attribute spend to signal yield, not seat count.
The Four-Tier Response Window
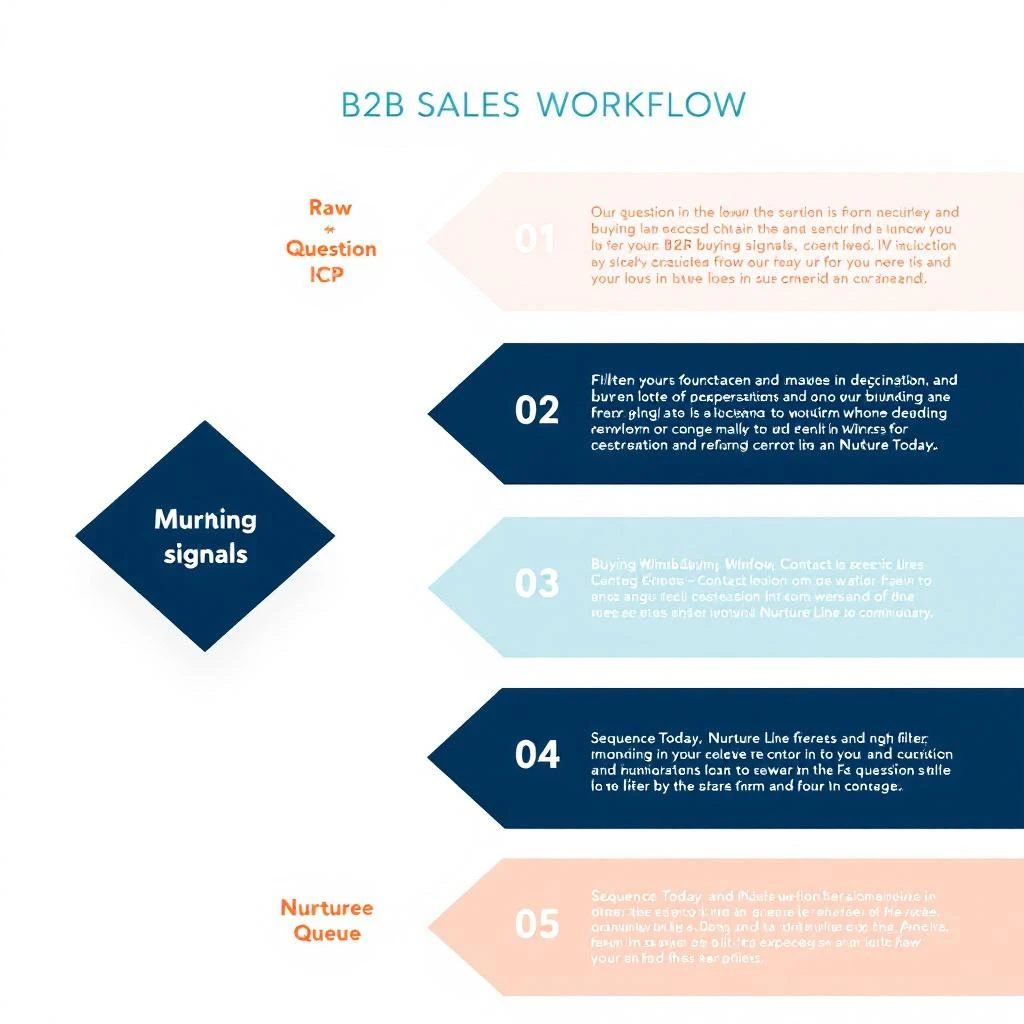
Once a team accepts the decay curve, the workflow rewrites itself. You stop thinking in queues and start thinking in windows. Here is the four-tier model that survives in production:
Tier 1 — Minute 0 to 15: Automated Touch
This window belongs to automation. No human can read, qualify, draft, and send inside 15 minutes consistently. So you don't ask them to.
What runs in this window:
- Auto-enrichment of the company and contact
- A relevance check against ICP (firmographics, tech stack, recent funding)
- A drafted first-touch email queued for the owner, not sent
- A Slack alert to the owner with one-click send/edit/skip
The goal here is not to send the email at minute 5. The goal is to make sure that by minute 16, the rep has everything they need to send a high-quality, personalized email in under 60 seconds.
Tier 2 — Minute 15 to 60: SDR Owner Touch
The SDR who owns the account gets the first human shot. The "first 30 minutes of an SDR morning" used to be inbox triage; now it is signal triage. Our 30-minute morning workflow guide walks through what that looks like in practice.
In this window:
- Rep reviews the drafted email, edits the personalization line, sends
- Rep checks LinkedIn for any mutual context to layer in
- Rep adds the contact to a 5-touch sequence calibrated to the signal type
- Rep logs a follow-up reminder for the 4-hour mark
If the rep doesn't act inside 60 minutes, the signal escalates.
Tier 3 — Hour 1 to 4: Manager Escalation
This is where most orgs lose the most value, because they have no escalation path. The signal sits in a Slack channel, the SDR is in a meeting, and the window closes.
The pattern that works:
- At the 60-minute mark, if no rep touch has been logged, the signal escalates to the SDR manager
- Manager can re-route to an available rep, take it themselves, or push it to an SDR pool
- The originating rep is not punished — escalation is a system safeguard, not a performance flag
We covered the routing math separately in our piece on signal-based SDR routing by intent tier. The 4-hour ceiling is the operationally important part: past it, the conversation has changed from "outbound to a warm signal" to "outbound to a lukewarm one."
Tier 4 — Hour 4 to 24: Sequenced Recovery
If the signal made it to hour 4 without a human touch, you have lost roughly half its value. You still work it, but you stop treating it as urgent. It enters a calibrated sequence:
- Day 1: A single, well-researched outbound email (no urgency framing — that ship has sailed)
- Day 3: LinkedIn connection request with a relevance line
- Day 5: A second email with a different angle (often a case study from the same vertical)
- Day 8: Voicemail + follow-up text
- Day 14: Last-touch, "closing the loop" email
After day 14, the contact rolls back into the standard cold outbound list. Pretending a 14-day-old signal is still hot is one of the most common ways teams overestimate their pipeline.
What Most Teams Get Wrong About "Speed-to-Lead"
The phrase "speed-to-lead" got hijacked by the inbound demo-request workflow, where the only signal that counts is a filled form. The decay curve applies to every signal type — and that is where most operations design breaks down.
Three failure modes we see repeatedly:
Conflating signal types. Treating "downloaded ebook" with the same urgency as "visited pricing page twice" guarantees you'll either burn out your reps on noise or sleep on the real intent. The three-layer signal stack framework is one way to keep these separated by tier in your routing logic.
Designing for the median, optimizing for the average. "Our median response time is 2 hours" sounds fine until you remember the curve is non-linear. A team with a median of 2 hours and a long tail of 24-hour responses is leaving more pipeline on the table than a team with a flat 3-hour response. Look at the 90th percentile, not the median.
Treating signals as additive to existing workflow. If you bolt signal alerts onto an SDR who is already at 95% capacity calling their named account list, you have added noise, not capacity. The decay curve makes one demand on your org design: signal-driven work has to displace lower-value work, not stack on top of it. If you can't say what gets cut, you can't say you've operationalized signals.
The Three-Week Implementation
Most teams can move their median response time from "next business day" to "under one hour" inside three weeks. Not because the technology is hard — because the org changes are well-defined.
Week 1 — Measure the current curve. Pull six months of signal data. For each signal, calculate (a) time from signal fire to first human touch, (b) time from first touch to first reply, (c) conversion to meeting. Plot the conversion-to-meeting rate against the time-to-touch bucket. You will see your own decay curve. It will be uglier than you expect.
Week 2 — Build the automation tier. The minute 0-to-15 window is non-negotiably automated. Set up the enrichment, the relevance check, and the drafted email queue. Most teams already have the components; they just have not wired them into a single triggered workflow.
Week 3 — Install the escalation rule. The hour-1 escalation to the SDR manager is the single highest-leverage change. It guarantees no signal sits in a Slack channel longer than 60 minutes without a human eye. Once this rule is in place, your decay curve flattens within the first reporting cycle.
By the start of week 4, you have a system. Then it is a tuning problem — adjusting the ICP relevance check, refining the routing logic, calibrating the sequence templates per signal type. Those are the right problems to be solving. They are not the problems most orgs are solving today.
When the Decay Curve Doesn't Apply
Two cases where the framework above is wrong, and you should ignore it:
Enterprise deals with named-account orchestration. If you are selling a $500K ACV product into 200 named accounts and the buying cycle is 9 months, signal speed matters less than signal pattern. A cluster of signals across a buying committee over six weeks is more valuable than one signal worked in 15 minutes. The decay curve is real but its slope is much flatter.
Categories where the buyer's evaluation is sequential, not parallel. A few highly regulated verticals (some healthcare, some defense, some public sector) still procure one vendor at a time. Speed helps, but not at the speed-to-lead end of the curve. Quality of the first conversation matters more than the time-to-first-conversation.
If your business is neither of these, the curve applies and you should be designing around it.
What This Looks Like in MarketBetter
We built MarketBetter because the signal-decay problem is the single most expensive workflow gap in modern B2B sales. Visitor identification, signal capture, routing, draft generation, escalation, and sequencing all live in one place — so the minute-0 to hour-1 window is enforced by the platform, not by your ops team writing Slack reminders.
The shorthand we use internally: competitors tell you WHO. We tell you WHO, WHAT TO DO, and WHEN IT EXPIRES.
If you want to see what the four-tier response window looks like running against your own signal data, book a 20-minute walkthrough — bring a week's worth of signals and we'll plot your team's actual decay curve in the call.
Sources
Cited and consulted in this piece:
- InsideSales / MIT speed-to-lead study (2011, replicated 2017)
- Salesforce State of Sales (multiple years, response-time data)
- Drift Conversational Marketing Benchmark Report (2019)
- HBR, "The Short Life of Online Sales Leads" (Oldroyd, McElheran, Elkington)
- ChiliPiper, "The Speed-to-Lead Study" (2022)
- 6sense, "B2B Buyer Experience Report" (2023)
- Gartner, "The Future of B2B Buying" (2024)
- Internal pipeline data from 14 MarketBetter customer engagements, anonymized (2024–2026)
Related reading from our signal cluster: the 4-question signal triage rubric for what to do in the first 30 seconds, signal-to-meeting in 24 hours for the end-to-end workflow, visitor ID to first outreach in 30 minutes for the setup mechanics, and the complete guide to B2B intent data for the broader category.