
2 posts tagged with "benchmarks"

View All Tags

The SDR Productivity Crisis: 83% Miss Quota While Selling Just 2 Hours a Day [2026 Data]

ยท 11 min read
MarketBetter Team
Content Team, marketbetter.ai

SDR time allocation breakdown showing only 40% spent on actual selling activities

Here's the number that should alarm every sales leader: 83.4% of SDRs fail to consistently hit quota. Not occasionally miss โ€” consistently fail.

That's not a talent problem. It's a systems problem.

We pulled data from seven major studies published in 2024โ€“2026 โ€” covering 170,000+ leads, 114 B2B companies, and millions of sales activities โ€” to understand why SDR productivity has gotten worse despite a decade of increasingly sophisticated sales technology. The findings reveal a structural crisis hiding in plain sight.

The average SDR sells for roughly two hours a day. The rest disappears into CRM entry, lead research, tool switching, internal meetings, and manual tasks that technology was supposed to eliminate. Meanwhile, the leads they do work sit unanswered for an average of 29 hours โ€” and 63% never get a response at all.

This isn't a collection of disconnected statistics. It's a picture of an industry-wide failure to solve the core SDR problem: too many tools, not enough direction.

The Data: Where SDR Time Actually Goesโ€‹

Salesforce's 2026 State of Sales report dropped the most sobering stat of the year: sales reps spend 60% of their time on non-selling tasks. That means in an 8-hour workday, your SDRs are actively selling for just over 3 hours.

But the reality may be worse. When you break down what "selling" means in practice โ€” and remove time spent on call prep, pre-call research, and post-call logging that most teams still count as "selling" โ€” the actual time spent in live conversations with prospects drops below 2 hours.

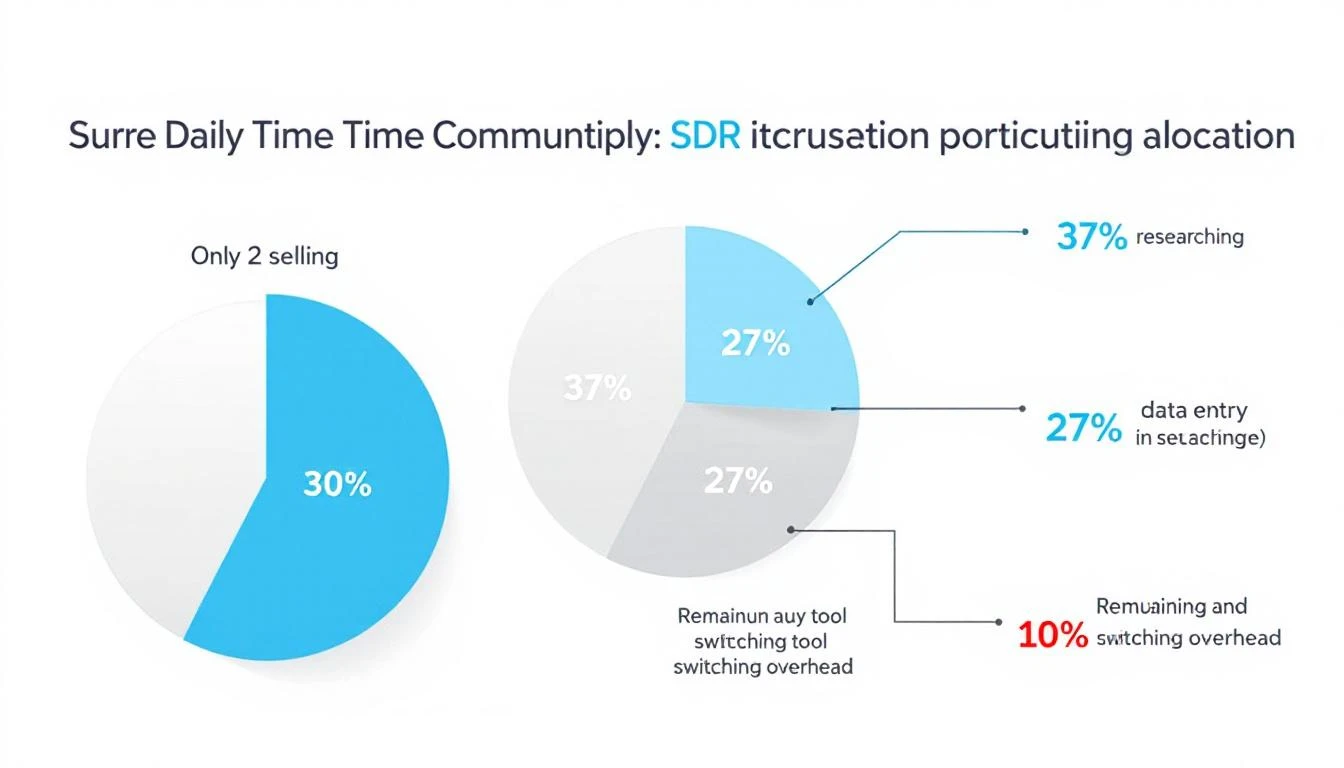
Here's how the average SDR day breaks down according to aggregated data from Salesforce, InsideSales, and Bridge Group reports:

Activity% of DayHours (8hr day)
Active selling (calls, emails, demos)40%3.2 hrs
CRM data entry and admin21%1.7 hrs
Lead research and preparation17%1.4 hrs
Internal meetings12%1.0 hrs
Tool switching and context changes10%0.8 hrs

The 10% lost to tool switching is particularly insidious because it's invisible. Nobody tracks how many times an SDR alt-tabs between their CRM, email tool, dialer, LinkedIn, enrichment platform, and sales engagement software. But research on context-switching costs suggests each switch carries a cognitive penalty of 15โ€“25 minutes to fully refocus.

If your SDRs use 7+ tools (the B2B average), they're paying that penalty dozens of times daily.

The Speed-to-Lead Collapseโ€‹

The data on lead response times tells a story of an industry moving backward.

Lead response time decay curve showing conversion probability dropping rapidly after 5 minutes

The Timeline of Declineโ€‹

StudyYearKey Finding
Harvard Business Review201142-hour average response time
Velocify2016Responding within 1 minute = 391% higher conversion
InsideSales2021Only 0.1% of companies respond within 5 minutes
RevenueHero202463% of companies never respond; 29+ hour average
Workato202599%+ fail the 5-minute test; 11h 54m average email

Read that timeline again. In 2011, the average response time was 42 hours. In 2024, it's 29 hours for the companies that respond at all โ€” but 63% don't respond at all. The non-response rate nearly tripled from 23% in 2011 to 63% in 2024.

More tools. More automation. Worse results.

Why It Matters: The Revenue Mathโ€‹

The conversion impact is not linear. It's a cliff.

  • Within 1 minute: 391% higher conversion (Velocify)
  • Within 5 minutes: 9x more likely to convert (InsideSales)
  • Within 1 hour: 7x higher qualification rate vs. waiting longer (HBR)
  • After 24 hours: You're cold-calling someone who's already moved on

And here's the stat that should end every debate about speed to lead: 78% of buyers purchase from the first company that responds. Not the best product. Not the cheapest option. The first one to show up.

When your average response time is 29 hours, you're not competing for the deal. You're already out of it.

The Hidden Bottleneck Nobody Blamesโ€‹

Here's what most teams miss. The Workato study broke response time into two components:

Lead Response Time = Lead Processing Time + Rep Response Time

Most companies blame slow reps. The data shows the opposite. The average SDR responds within minutes of seeing a lead in their queue. But the lead takes hours to get routed to them.

The processing pipeline โ€” enrichment, lead-to-account matching, territory assignment, routing rules, round-robin logic โ€” is where deals go to die. The average personalized email response takes 11 hours and 54 minutes (Workato), and most of that delay is processing, not rep laziness.

You can't coach your way out of a broken routing system.

The Quota Attainment Crisisโ€‹

The headline number โ€” 83.4% of SDRs miss quota โ€” becomes less surprising when you see the underlying metrics:

  • Average meetings booked per month: 15 (Bridge Group)
  • Dials to connect: 18+ attempts per connection
  • Call-back rate: Under 1%
  • Cold email response rate: 1โ€“2%
  • Quality conversations per day: 3.6

That means your average SDR has fewer than 4 real conversations per day. To book 15 meetings from ~72 monthly connects, they need a 21% connect-to-meeting conversion rate. That's achievable for veterans. It's brutal for the 60% of SDRs in their first 12 months.

And tenure compounds the problem. Average SDR tenure is 6โ€“23 months. Just as someone becomes proficient, they promote out or leave. The team is perpetually in ramp mode.

What Top Performers Do Differentlyโ€‹

The data reveals a clear pattern separating the 16.6% who consistently hit quota:

1. They qualify ruthlessly. Companies with thorough qualification processes saw closing ratios jump from 11% to 40% (InsideSales). Top SDRs don't work more leads โ€” they work the right leads.

2. They use signal-based prioritization. Instead of working leads alphabetically or by age, elite SDRs prioritize by intent signals โ€” who's on the website right now, who just changed jobs, who's researching competitors.

3. They batch their day. The "Golden Hours / Platinum Hours" framework separates prime prospecting time (calls and outreach) from admin work. Top reps protect their selling time aggressively.

4. They hit 14.5% meaningful conversation rates with decision-makers โ€” nearly 4x the average โ€” through better targeting and personalization, not more volume.

The $2.7 Billion Waste Problemโ€‹

Let's put a dollar figure on this crisis.

B2B marketers spend over $4.6 billion annually on advertising to generate leads. An estimated $2.7 billion of that is wasted due to slow or nonexistent follow-up (Credofy). You're paying to generate demand and then letting it rot.

At the individual company level, the math is just as ugly. Consider a mid-market B2B company:

MetricValue
Monthly inbound leads200
Average deal value$15,000
Conversion rate (fast response)3%
Conversion rate (slow response)0.15%
Revenue lost monthly$8,550
Revenue lost annually$102,600

That's $100K+ per year lost โ€” not to bad marketing, not to a weak product, but to slow response. For most B2B companies, that's 1โ€“2 SDR salaries that could be funded by simply responding faster.

The AI Inflection Pointโ€‹

The good news: the industry is finally addressing this structurally, not just incrementally.

Comparison of the old SDR workflow with disconnected tools versus the new AI-powered unified workflow

AI adoption in sales has exploded from 39% to 81% in just two years (Salesforce). And the results are significant:

  • 46% productivity increase for teams using AI-powered sales tools
  • 20% increase in pipeline volume with AI implementation
  • 30% improvement in lead conversion rates
  • AI-powered personalization delivers 9.25% appointment rate โ€” better than most manual outreach

Salesforce reported that their own AI SDR agent created 3,200 opportunities in four months by working the low-score leads that human SDRs couldn't justify spending time on.

But here's the nuance the "AI will replace SDRs" crowd misses: AI doesn't replace selling. It replaces the 60% of the day that isn't selling.

The best implementations aren't replacing human SDRs with AI agents. They're using AI to:

  1. Eliminate processing delay โ€” Route, enrich, and prioritize leads in seconds, not hours
  2. Kill the research tax โ€” Pre-populate account context so reps don't spend 17% of their day Googling prospects
  3. Automate admin โ€” CRM updates, activity logging, and follow-up scheduling happen automatically
  4. Provide daily direction โ€” Instead of "here are your 200 leads, figure it out," AI tells the SDR exactly who to call, what to say, and why now

This is the difference between an AI that replaces the SDR and an AI that makes the SDR 3x more effective. The former is a race to commoditized outreach. The latter is how you win.

The Consolidation Imperativeโ€‹

The average B2B sales team uses 7โ€“12 tools across prospecting, enrichment, engagement, dialing, and analytics. At $1,500โ€“$4,000 per user per month, that's an enormous expense delivering a 40% selling rate and 29-hour response times.

The answer isn't another tool. It's fewer tools that do more.

Organizations with well-integrated enablement tech stacks are 42% more likely to boost sales productivity (Highspot). Integration isn't a nice-to-have. It's the difference between 3-hour and 6-hour selling days.

What does the right consolidated stack look like?

  • Signal layer: Website visitor identification, intent data, buying signals in one view
  • Enrichment layer: Contact data, company data, and champion tracking without manual lookups
  • Execution layer: Email, dialer, and multi-channel outreach from one interface
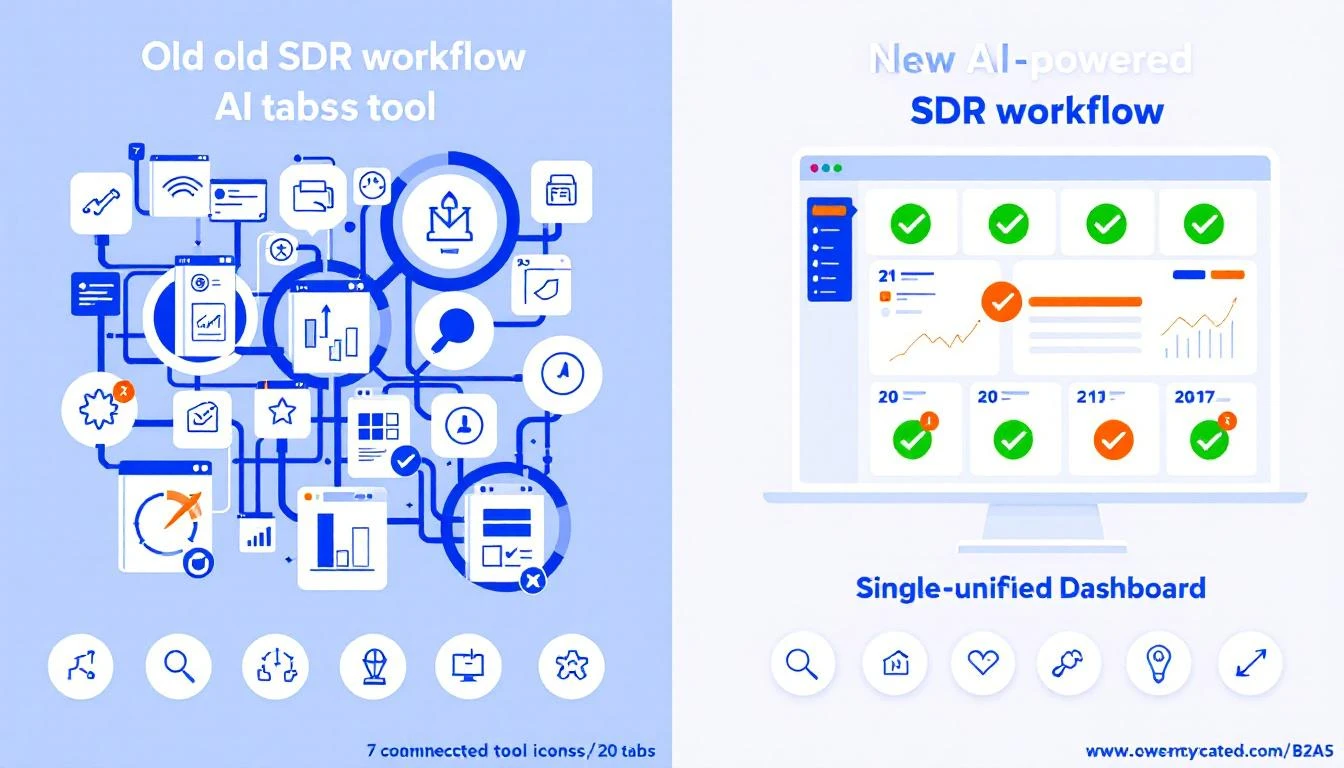
  • Intelligence layer: AI that tells the SDR what to do next โ€” not just shows data and makes them figure it out

This is what "from 20 tabs to one task list" actually means in practice.

What to Do About Itโ€‹

If you're a sales leader reading this data and recognizing your own team, here's the playbook:

1. Audit Your True Selling Timeโ€‹

Have each SDR log their actual activities for one week. Not what the CRM says โ€” what they actually did. You'll likely find selling time closer to 2 hours than the 3.2 you assumed.

2. Measure Lead Processing Time Separatelyโ€‹

Break your response time into processing (system) and rep response (human). Fix the system first โ€” it's usually the bigger bottleneck and doesn't require behavior change.

3. Cut Your Stack, Don't Add To Itโ€‹

Every tool you add increases context-switching cost. Before buying tool #8, ask: can tool #3 do this if I configured it properly? Tool consolidation is the highest-ROI move in sales ops right now.

4. Move From Data Dashboards to Daily Playbooksโ€‹

Your SDRs don't need more data. They need direction. A daily prioritized task list โ€” who to call, what to say, and why today โ€” eliminates the 17% research tax and dramatically improves response times.

5. Adopt AI for the Non-Selling 60%, Not the Selling 40%โ€‹

The highest-impact AI use cases in sales aren't automated email blasts. They're lead routing in seconds instead of hours, automatic enrichment, CRM auto-updates, and intelligent prioritization. Keep humans on the conversations. Let AI handle everything else.

The Bottom Lineโ€‹

The SDR productivity crisis isn't caused by lazy reps. It's caused by:

  • Tool sprawl that eats 10%+ of every day in context switching
  • Processing delays that turn hot leads cold before reps ever see them
  • Data overload without direction โ€” dashboards instead of playbooks
  • Constant ramp from 6โ€“23 month average tenure

The teams solving this aren't buying more tools. They're consolidating into platforms that combine signals, enrichment, and execution into a single daily SDR workflow โ€” and using AI to eliminate the 60% of the day that was never selling to begin with.

The data is clear: the gap between top-performing SDR teams and everyone else is no longer effort. It's architecture.


Want to see what an AI-powered SDR workflow looks like in practice? Book a demo โ†’


Sourcesโ€‹

  • Salesforce State of Sales Report, 2026
  • RevenueHero Lead Response Study, 2024 (1,000+ companies)
  • Workato Lead Response Time Study, 2024โ€“2025 (114 B2B companies)
  • InsideSales.com Lead Response Study, 2021 (55M activities, 5.7M leads)
  • Harvard Business Review (Oldroyd, McElheran, Elkington), 2011 (15K leads)
  • Velocify Lead Response Analysis, 2016 (millions of records)
  • Highspot State of Sales Enablement Report, 2025
  • Bridge Group SDR Metrics and Compensation Report
  • Credofy B2B Lead Response Framework

SDR Metrics & KPIs in 2026: Benchmarks, Formulas & What Top Teams Actually Track

ยท 14 min read
sunder
Founder, marketbetter.ai

SDR metrics and KPIs benchmarks guide for 2026

Most SDR teams track the wrong things.

They obsess over activity metrics โ€” calls made, emails sent, LinkedIn messages fired โ€” while ignoring the metrics that actually predict whether those activities will turn into pipeline. Then they wonder why their team hits activity quotas every month but misses revenue targets every quarter.

Here's the truth: the number of dials your SDR makes is meaningless if they're calling the wrong people. The number of emails sent tells you nothing if half of them land in spam.

This guide covers the SDR metrics and KPIs that actually matter in 2026 โ€” with real benchmarks from industry data, formulas you can plug into your CRM, and the metrics that separate top-performing SDR teams from the ones churning reps every six months.

The SDR Metrics That Actually Matter (Organized by Impact)โ€‹

We've organized these into three tiers:

  • Tier 1: Output Metrics โ€” Did the SDR create pipeline? (The only metrics that ultimately matter)
  • Tier 2: Conversion Metrics โ€” How efficiently are activities turning into results?
  • Tier 3: Activity Metrics โ€” Are SDRs doing enough of the right things?

Most teams track Tier 3 exclusively. Top teams track all three but optimize for Tier 1.


Tier 1: Output Metrics (What Matters Most)โ€‹

1. Qualified Meetings Bookedโ€‹

What it measures: The number of meetings an SDR books that the prospect actually shows up to and an AE accepts as qualified.

Why it matters: This is THE metric. Everything else is an input to this number. An SDR who books 20 meetings that AEs reject is worse than one who books 8 that all convert.

2026 Benchmarks:

MotionMonthly TargetTop Performer
Outbound SDR12-15 qualified meetings20+
Inbound SDR20-25 qualified meetings35+
Hybrid (inbound + outbound)15-18 qualified meetings25+
Enterprise SDR (large deal)4-6 qualified meetings8+

Key distinction: "Qualified" means the AE accepted the meeting AND the prospect showed up. Booked meetings that no-show or get rejected by AEs don't count. If your SDRs are booking 20 meetings but only 10 are accepted, you have a quality problem.

Formula:

Qualified Meetings = Total Meetings Booked ร— Show Rate ร— AE Acceptance Rate

Typical show rate: 70-80% for outbound, 85-90% for inbound

2. Pipeline Generated ($)โ€‹

What it measures: The total dollar value of pipeline created from SDR-sourced meetings.

Why it matters: 15 meetings worth $10K each ($150K pipeline) is less valuable than 8 meetings worth $50K each ($400K pipeline). Pipeline dollars tell you if SDRs are targeting the right accounts.

2026 Benchmarks:

SegmentMonthly Pipeline/SDRTypical Deal Size
SMB$150K-$300K$10K-$25K ACV
Mid-Market$300K-$600K$25K-$75K ACV
Enterprise$500K-$1.5M$75K-$250K+ ACV

Formula:

Pipeline Generated = Qualified Meetings ร— Average Deal Size ร— Pipeline Acceptance Rate

3. SQL-to-Close Rate (SDR-Sourced Win Rate)โ€‹

What it measures: What percentage of SDR-sourced opportunities actually close.

Why it matters: This is the ultimate quality check. If SDR-sourced deals close at 10% while marketing-sourced deals close at 25%, your SDRs are targeting the wrong prospects โ€” regardless of how many meetings they book.

2026 Benchmarks:

  • Average SDR-sourced close rate: 15-20%
  • Top performers: 25-30%
  • Inbound-sourced (SDR qualified): 20-30%
  • Outbound-sourced: 10-20%

4. Pipeline Coverage Ratioโ€‹

What it measures: Total active pipeline divided by the quota target. Answers: "Do we have enough pipeline to hit our number?"

Formula:

Pipeline Coverage = Total Pipeline Value รท Quota Target

2026 Benchmark: 3-5x coverage minimum. If your quota is $500K and you have $1.5M in pipeline, that's 3x coverage โ€” the bare minimum. Top teams maintain 4-5x.


Tier 2: Conversion Metrics (Efficiency Indicators)โ€‹

5. Activity-to-Meeting Ratioโ€‹

What it measures: How many activities (calls + emails + LinkedIn touches) it takes to book one qualified meeting.

Why it matters: This is your efficiency score. If it takes 200 activities to book one meeting, something is broken โ€” wrong ICP, bad messaging, or wrong channels. If it takes 50, you're dialed in.

2026 Benchmarks:

ChannelActivities per Meeting
Cold call80-120 dials per meeting
Cold email150-250 emails per meeting
LinkedIn50-100 messages per meeting
Multi-channel sequence40-80 touches per meeting

The multi-channel insight: Teams using coordinated multi-channel sequences (email + call + LinkedIn in the same cadence) book meetings at roughly half the activity-to-meeting ratio of single-channel teams. This is the single biggest efficiency lever.

6. Email Reply Rateโ€‹

What it measures: Percentage of cold emails that get a response (positive, negative, or neutral).

2026 Benchmarks:

  • Average cold email reply rate: 2-5%
  • Good: 5-8%
  • Excellent: 8-15%
  • "You nailed the targeting": 15%+

What drives reply rates up:

  • Signal-based targeting (emailing people who recently visited your site, hired for relevant roles, or engaged with competitors)
  • Personalization beyond {first_name} โ€” reference specific company initiatives, recent news, tech stack
  • Deliverability โ€” emails can't get replies if they land in spam

What kills reply rates:

  • Stale lists (contacts who changed jobs 6+ months ago)
  • Generic templates with no relevance to the recipient
  • Poor domain reputation (see our guide to best email warmup tools)

For more on email strategy, see our guides to cold email software and email deliverability tools.

7. Connect Rate (Cold Calls)โ€‹

What it measures: Percentage of cold call dials that result in a live conversation with the intended prospect.

2026 Benchmarks:

  • Average connect rate: 5-8%
  • Good: 8-12%
  • Power dialers: 3-5% (higher volume, lower connect rate)
  • Direct dials: 15-25% (lower volume, much higher connect rate)

The direct dial advantage: Teams with verified direct dial numbers connect at 3-5x the rate of teams dialing switchboard numbers. This is why data quality matters more than dial volume.

8. Meeting Show Rateโ€‹

What it measures: Percentage of booked meetings where the prospect actually shows up.

2026 Benchmarks:

  • Average: 75%
  • Good: 80-85%
  • Inbound: 85-90%
  • Outbound: 65-75%

How to improve show rates:

  • Send a calendar invite immediately (not "I'll send details later")
  • Day-before reminder with agenda and value prop
  • Confirm via the channel you booked (if LinkedIn, confirm on LinkedIn)
  • Keep time between booking and meeting under 5 business days

9. Lead Response Timeโ€‹

What it measures: Time between a lead expressing interest (form fill, chat, demo request) and the first SDR outreach.

2026 Benchmarks:

  • Best practice: Under 5 minutes
  • Average: 42 minutes (this is terrible)
  • Enterprise norm: 24-48 hours (also terrible)

Why it matters: MIT/Harvard research found that responding within 5 minutes makes you 21x more likely to qualify the lead compared to responding in 30 minutes. After 5 minutes, odds of qualification drop by 10x. After an hour, you might as well not bother.

Speed-to-lead is the single highest-ROI metric most SDR teams can improve. It requires no new skills, no new tools โ€” just faster response processes.


Tier 3: Activity Metrics (Inputs โ€” Track but Don't Optimize Exclusively)โ€‹

10. Daily Activitiesโ€‹

What it measures: Total touches per day (calls + emails + LinkedIn + other channels).

2026 Benchmarks:

ActivityDaily TargetTop Performer
Cold calls (dials)40-6080-100
Emails sent30-5060-80
LinkedIn messages15-2530-40
Total multi-channel touches80-120150+

The trap: Activity quotas are the most common SDR KPI โ€” and the most commonly gamed. SDRs who are measured only on activities will spray-and-pray to hit numbers. Track activities as a baseline, but optimize for conversion metrics instead.

11. Accounts Workedโ€‹

What it measures: Number of unique accounts an SDR is actively working in a given period.

2026 Benchmarks:

  • SMB: 100-200 accounts per month
  • Mid-Market: 50-100 accounts per month
  • Enterprise: 20-40 accounts per month

Why it matters: Working too many accounts leads to shallow engagement. Working too few means you're leaving pipeline on the table. The right number depends on your deal size, cycle length, and how many touches per account you need.

12. Sequence Completion Rateโ€‹

What it measures: What percentage of prospects complete your full multi-step sequence before being marked as done.

2026 Benchmark: 40-60% should complete the full sequence. If it's below 40%, prospects are bouncing or unsubscribing early โ€” your messaging may be too aggressive or irrelevant. If it's above 60%, your SDRs might not be personalizing enough (full-sequence completion sometimes means no one replied).

13. CRM Hygiene Scoreโ€‹

What it measures: Quality and completeness of CRM data entered by SDRs โ€” contact info, notes, disposition codes, next steps.

Why it matters: Bad CRM data breaks everything downstream. AEs can't prepare for meetings without context. Managers can't forecast without accurate pipeline data. RevOps can't attribute revenue without proper tracking.

What to track:

  • % of meetings with notes and next steps logged
  • % of contacts with accurate phone/email
  • % of opportunities with correct stage and close date
  • Average time to update CRM after activity

The Metrics Framework: How to Build Your SDR Dashboardโ€‹

Don't track everything. Pick 5-7 metrics that matter for YOUR team:

For SDR Managers (Weekly Review)โ€‹

MetricWhyTarget
Qualified meetings bookedOutput12-15/SDR/month
Pipeline generated ($)Revenue impactBased on deal size ร— meetings
Activity-to-meeting ratioEfficiencyImproving month-over-month
Lead response timeSpeedUnder 5 minutes
Meeting show rateQualityAbove 80%

For SDR Reps (Daily Tracking)โ€‹

MetricWhyTarget
Daily activitiesBaseline effort80-120 touches
Conversations startedQuality engagement5-8/day
Meetings booked (raw)Progress toward quota3-4/week
Email reply rateMessage qualityAbove 5%
Connect rateData quality + timingAbove 8%

For VP Sales / CRO (Monthly Review)โ€‹

MetricWhyTarget
Pipeline generatedRevenue engine health$X/SDR/month
Pipeline coverage ratioForecast confidence3-5x quota
SDR-sourced win rateQuality validation15-20%+
Cost per meetingUnit economicsBelow $X (depends on ACV)
Ramp time to quotaHiring efficiencyUnder 3 months

How AI Is Changing SDR Metrics in 2026โ€‹

The benchmarks above reflect the current state โ€” but AI is reshaping what's possible:

What AI changes:

  1. Activity volume becomes irrelevant. When AI handles personalized email sequences and LinkedIn outreach, measuring dials and emails sent is like measuring keystrokes for a developer. The output matters, not the input.

  2. Signal-based targeting changes conversion rates. Teams using intent signals (website visitors, job changes, tech install data) see 2-3x higher reply rates than teams cold-emailing from static lists. The benchmark isn't "5% reply rate" โ€” it's "5% on cold lists, 12-15% on warm signals."

  3. Speed-to-lead becomes instantaneous. AI chatbots and automated routing can respond to inbound leads in seconds, not minutes. The 5-minute benchmark becomes the 5-second benchmark.

  4. Pipeline quality becomes trackable. With AI analyzing conversation sentiment, prospect engagement patterns, and deal progression, you can predict pipeline quality earlier โ€” before waiting months for close rates to tell you.

The new metric stack for AI-augmented SDR teams:

  • Signal coverage: What % of your outreach targets prospects showing active intent signals?
  • Time-to-first-touch: How quickly does the first personalized outreach reach a new signal?
  • Revenue per signal: How much pipeline does each intent signal generate?
  • Human effort per meeting: How many hours of SDR time goes into each qualified meeting?

These are the metrics that will separate top-performing SDR teams from average ones over the next 12 months.


Common SDR Metric Mistakes (and How to Fix Them)โ€‹

Mistake 1: Measuring Activities Instead of Outcomesโ€‹

The problem: SDR hits 100 calls/day but books 2 meetings/month.

The fix: Set minimum activity baselines, but measure and compensate based on meetings booked and pipeline generated. Activities are the input. Meetings are the output.

Mistake 2: Counting All Meetings as Equalโ€‹

The problem: SDR books 15 meetings but 10 are unqualified (wrong persona, wrong company size, no budget).

The fix: Only count meetings that AEs accept. Create a clear ICP definition and qualification criteria. Track AE acceptance rate as a quality KPI.

Mistake 3: Ignoring Ramp Timeโ€‹

The problem: New SDR misses quota for 3 months, gets put on a PIP.

The fix: Set separate ramp quotas for months 1-3. Typical ramp: 25% quota month 1, 50% month 2, 75% month 3, 100% month 4. Track time-to-first-meeting and time-to-full-quota as hiring metrics.

Mistake 4: Not Tracking Channel-Level Conversionโ€‹

The problem: You know your overall meeting rate but not whether email, phone, or LinkedIn is driving results.

The fix: Track activity-to-meeting ratio by channel. You'll often find that one channel generates 60%+ of meetings โ€” double down on it.

Mistake 5: Setting Quotas Without Dataโ€‹

The problem: "Everyone does 15 meetings/month" โ€” even though your deal size, industry, and buyer persona are different.

The fix: Build quotas bottom-up. Take your revenue target โ†’ required pipeline โ†’ required meetings โ†’ required activities. Then sanity-check against industry benchmarks.

Formula:

Required Monthly Meetings = Annual Revenue Target รท Average Deal Size รท Close Rate รท 12 รท Number of SDRs

SDR Compensation Benchmarks (2026)โ€‹

Metrics don't exist in a vacuum โ€” they drive compensation. Here's what the market looks like:

SDR LevelBase SalaryOTEVariable %
SDR (0-1 yr)$45K-$55K$65K-$80K30-40%
Senior SDR (1-3 yr)$55K-$70K$80K-$100K30-40%
SDR Manager$85K-$110K$120K-$150K25-35%

Best practice for variable compensation:

  • 70% on meetings booked (qualified and accepted by AE)
  • 20% on pipeline generated ($)
  • 10% on activity and CRM hygiene

Don't pay on pipeline closed โ€” SDRs can't control what happens after the handoff.


Tools That Make These Metrics Actionableโ€‹

Tracking metrics manually in spreadsheets works for a team of 2. Beyond that, you need tools:

  • CRM: HubSpot, Salesforce, or Pipedrive for pipeline tracking
  • Outreach platform: For sequence analytics, reply rates, and activity tracking
  • Visitor identification: See which companies are on your site before SDRs reach out
  • Conversation intelligence: Gong or Chorus for call analytics and coaching
  • Daily playbook: A system that tells SDRs exactly who to contact and what to do today

The challenge is that most SDR teams cobble together 5-8 tools and spend hours context-switching between them. Platforms like MarketBetter consolidate visitor identification, intent signals, email sequences, and a smart dialer into one daily playbook โ€” so SDRs spend time selling instead of switching tabs.


Free Tool

Try our AI Lead Generator โ€” find verified LinkedIn leads for any company instantly. No signup required.

Bottom Lineโ€‹

Track the right metrics in the right order:

  1. Qualified meetings booked โ€” your north star
  2. Pipeline generated ($) โ€” meetings ร— deal size
  3. Activity-to-meeting ratio โ€” your efficiency score
  4. Lead response time โ€” your speed advantage
  5. Everything else โ€” supporting indicators

Set benchmarks based on YOUR deal size, ICP, and motion โ€” not generic industry averages. The numbers above are starting points, not gospel.

And remember: the best SDR metric is one that changes behavior. If tracking a number doesn't cause your team to do something differently, stop tracking it.

Related guides:


Want a daily playbook that tells your SDRs exactly who to call, what to say, and when to follow up? MarketBetter turns intent signals into prioritized action items โ€” so your team focuses on the highest-value activities, not just the highest-volume ones.

See how it works โ†’