How to Build a Lead Scoring Model Without a Data Scientist

Most B2B teams know they should be scoring their leads. Few actually do it well. According to Gartner, only 25-30% of B2B companies have a functioning lead scoring model — even though the data consistently shows that teams with scoring see 30% higher close rates and significantly shorter sales cycles.
The reason is not that scoring is conceptually hard. It is that most guides on the topic assume you have a data science team, a mature data warehouse, and six months to build a predictive model. The reality for most growing B2B teams: you have a CRM, some intent data, and you need something working by Friday.
This guide gives you exactly that. A practical scoring framework you can build in a spreadsheet, validate against your own pipeline data, and deploy into your daily SDR workflow — all without writing a single line of Python.
Why Most Lead Scoring Models Fail
Before building anything, it helps to understand why so many scoring models end up ignored. The failure modes are remarkably consistent:
Over-engineering the model. Teams spend months building 50-variable scoring algorithms, only to discover that three variables explain 80% of their conversions. Start simple. Add complexity only when you have data proving it helps.
Scoring individuals instead of accounts. In B2B, buying decisions involve 6-10 stakeholders on average. A single champion visiting your pricing page matters, but three people from the same company each reading different case studies matters more. Score at the account level, then identify the right contacts within high-scoring accounts.
Ignoring signal decay. A pricing page visit from yesterday is worth far more than one from six weeks ago. Without time decay built into your model, your "hot" list fills up with accounts that were interested in Q1 and have since signed with a competitor.
Set and forget. The scoring model that worked when you sold to mid-market SaaS companies may not work when you expand into healthcare. Recalibrate quarterly at minimum — compare your scored predictions against actual closed-won deals and adjust weights.
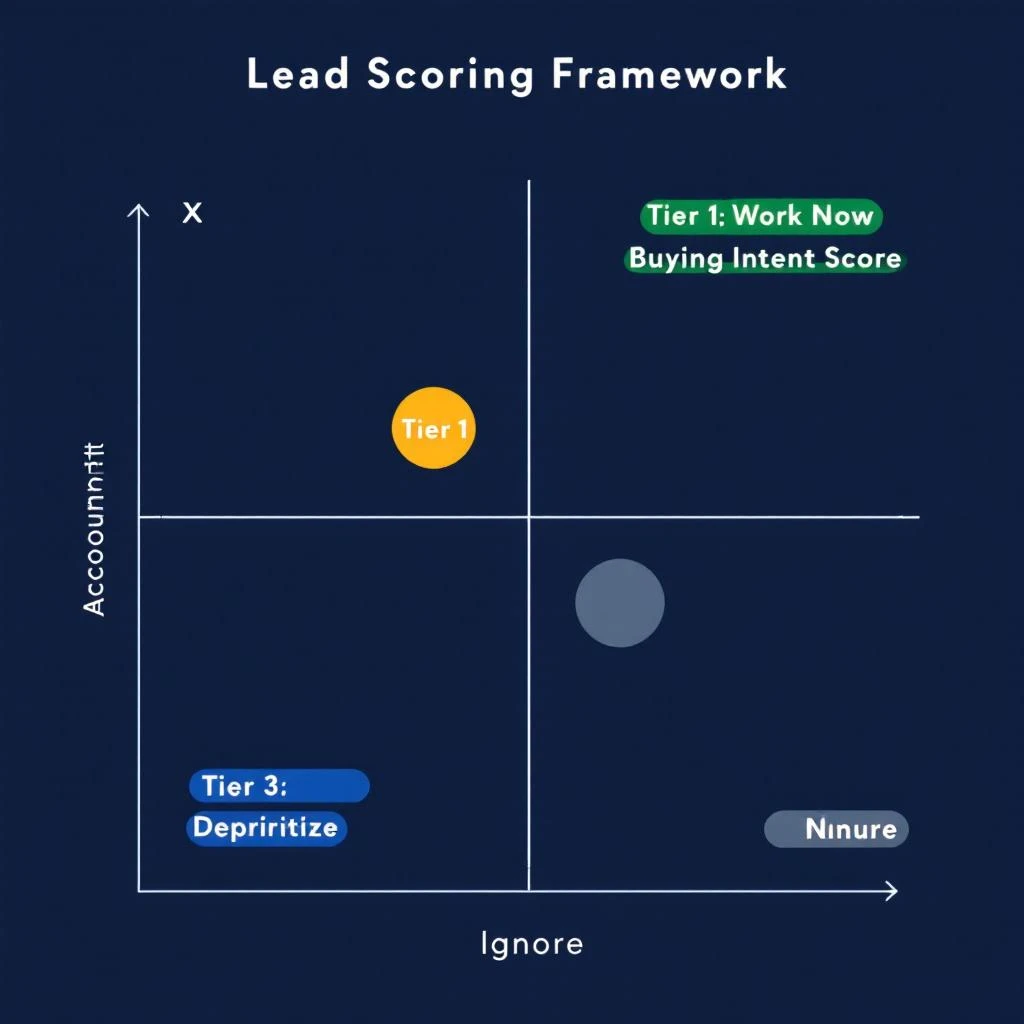
The Two-Axis Framework: Fit vs. Intent
The most reliable scoring approach for teams without a data science function is a two-axis model. Every account gets two scores:
Fit score — how well does this company match your ideal customer profile? This is relatively stable and based on firmographic and technographic data.
Intent score — how actively is this company researching solutions like yours right now? This is dynamic and based on behavioral signals.
Plotting accounts on these two axes gives you four quadrants:
| High Intent | Low Intent | |
|---|---|---|
| High Fit | Tier 1: Work immediately | Tier 3: Nurture — they match but are not ready |
| Low Fit | Tier 4: Deprioritize — interest without fit wastes cycles | Tier 5: Ignore |
There is also a Tier 2 for accounts with high fit and medium intent — these get sequenced within 24 hours rather than worked immediately.
This framework works because it forces a critical distinction: fit tells you who could buy, intent tells you who might buy soon. Most SDR teams over-index on one or the other. The teams that consistently hit quota work the intersection.
Step 1: Define Your Fit Score (30 minutes)
Your fit score should be based on 4-6 firmographic and technographic attributes that genuinely predict whether a company will buy from you. Not aspirational attributes — actual ones based on your existing customer base.
Pull a list of your last 20-30 closed-won deals and look for patterns across these dimensions:
Core Fit Attributes
| Attribute | Example Criteria | Points |
|---|---|---|
| Company size (employees) | 50-500 employees | 25 |
| Industry | SaaS, Fintech, Professional Services | 20 |
| Revenue range | $5M-$100M ARR | 15 |
| Geography | US, UK, DACH region | 10 |
| Tech stack signals | Uses Salesforce + outbound tooling | 15 |
| Funding stage | Series A through Series C | 15 |
Total possible fit score: 100
How to calibrate
Look at your closed-won deals and reverse-engineer the scores. If your best customers are almost always 100-300 person SaaS companies using Salesforce, then those attributes get the highest weights. If geography rarely affects whether a deal closes, give it fewer points or drop it entirely.
The goal is that your top 20 customers would all score 70+ on your fit model. If they do not, your attributes or weights are wrong.
Tier thresholds:
- 70-100: High fit (worth pursuing with active intent)
- 40-69: Medium fit (pursue only with strong intent)
- Below 40: Low fit (deprioritize regardless of intent)
Step 2: Define Your Intent Score (30 minutes)
Intent signals fall into two categories: first-party (what they do on your properties) and third-party (what they do elsewhere that suggests buying interest).
Signal Weights
| Signal | Category | Points | Decay |
|---|---|---|---|
| Demo request / pricing page visit | First-party | 30 | 7 days to zero |
| Case study or comparison page | First-party | 20 | 14 days to zero |
| Multiple stakeholders visiting your site | First-party | 25 | 14 days to zero |
| Third-party intent surge (Bombora, G2 research) | Third-party | 25 | 14 days to half, 30 days to zero |
| Champion job change (new role at target account) | Third-party | 30 | 30 days to zero |
| Blog / content engagement | First-party | 5 | 7 days to zero |
| Email opens / link clicks | First-party | 3 | 5 days to zero |
| LinkedIn engagement (ad clicks, profile views) | Third-party | 10 | 14 days to zero |
Total possible intent score: 148 (though realistically, accounts showing 50+ are strongly in-market)
The critical insight: signal stacking
No single signal is reliable on its own. A pricing page visit could be a competitor doing research. A content download could be a student writing a paper. But when signals stack — a pricing page visit plus a G2 comparison search plus two stakeholders viewing case studies — the probability of genuine buying interest compounds rapidly.
6sense's published benchmarks show that accounts identified as "in-market" through stacked intent signals convert at 6x the rate of traditional list-based outbound. Even if you discount vendor benchmarks by half, 3x is transformational for SDR productivity.
Tier thresholds:
- 50+: High intent (actively evaluating)
- 20-49: Medium intent (early research)
- Below 20: Low intent (no meaningful signals)
Step 3: Build the Scoring Spreadsheet (15 minutes)
You do not need a custom data platform to start. A well-structured spreadsheet gets you 80% of the value.
Column structure
| Column | Source | Notes |
|---|---|---|
| Company Name | CRM / enrichment | |
| Domain | CRM / enrichment | Primary key for deduplication |
| Employees | Enrichment (Fiber, Lusha, ZoomInfo) | |
| Industry | Enrichment | |
| Revenue | Enrichment | |
| Tech Stack | Enrichment | Comma-separated key technologies |
| Fit Score | Calculated | Sum of attribute points |
| Last Site Visit | Analytics / visitor ID | |
| Pages Visited | Analytics / visitor ID | Flag pricing, case study, comparison |
| Third-Party Intent | Bombora, G2, etc. | Surge score or category |
| Stakeholder Count | Analytics / visitor ID | Unique visitors from same domain |
| Champion Changes | UserGems, LinkedIn, etc. | |
| Intent Score | Calculated | Sum of weighted signals with decay |
| Combined Tier | Calculated | Lookup against the quadrant matrix |
| Last Updated | Auto | For decay calculations |
The formula
For each account, the combined tier is a simple lookup:
- Fit >= 70 AND Intent >= 50 → Tier 1
- Fit >= 70 AND Intent 20-49 → Tier 2
- Fit >= 70 AND Intent < 20 → Tier 3
- Fit 40-69 AND Intent >= 50 → Tier 2
- Fit 40-69 AND Intent 20-49 → Tier 3
- Everything else → Tier 4 or 5 (deprioritize)
This takes 15 minutes to set up. The ongoing work is feeding it fresh data — which is where automation becomes essential.
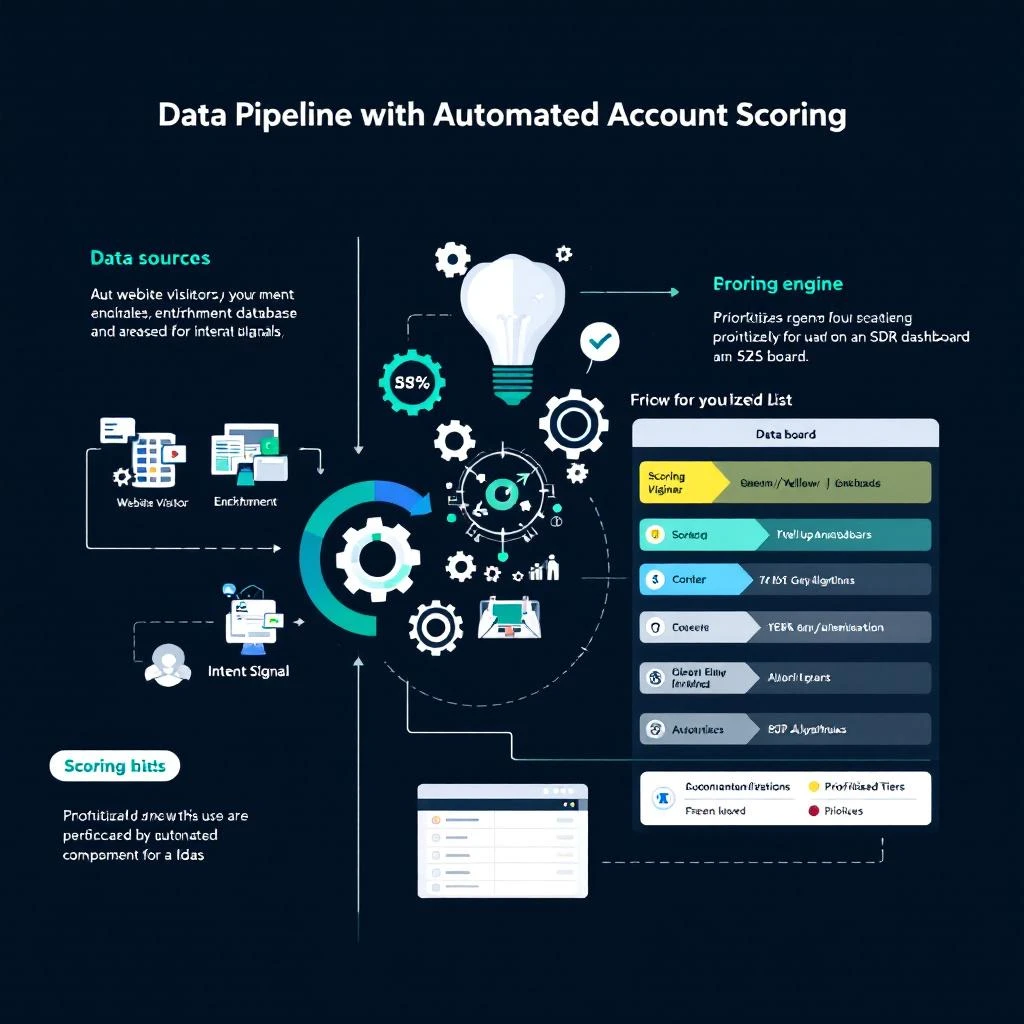
Step 4: Automate the Data Pipeline
A manual spreadsheet works for validating your model. It does not work at scale. Within two weeks, you will stop updating it and your SDRs will go back to working whatever list feels right.
The automation you need:
Visitor identification feeds first-party intent signals automatically. When someone from a target account visits your site, their company, pages viewed, and visit frequency should flow into your scoring model without anyone copying data from Google Analytics.
Multi-source enrichment keeps fit data current. Company size changes. Funding rounds close. Tech stacks evolve. Pulling from multiple providers — Fiber for technographics, Lusha for contact data, Exa for AI-extracted company intelligence — ensures your fit scores reflect reality, not last quarter's snapshot.
Account-level signal aggregation rolls individual visitor behavior up to the buying committee level. Three people from Acme Corp each visiting your comparison page in the same week is a far stronger signal than one person visiting three times. Your scoring system needs to distinguish between these.
Automated decay prevents stale signals from polluting your prioritization. If an account showed strong intent 45 days ago and has gone quiet, they should not still be sitting in Tier 1.
This is exactly what MarketBetter was built to do. The platform combines visitor identification, multi-provider enrichment, and signal intelligence into a single account scoring and prioritization layer. Your SDRs open one dashboard and see accounts ranked by the intersection of fit and intent — updated in real time, with signal decay built in.
Step 5: Validate Against Real Pipeline Data
A scoring model is a hypothesis. It needs validation.
After running your model for 30 days, pull two reports:
Report 1: Score-to-meeting conversion. Of the accounts your SDRs worked in each tier, what percentage converted to a meeting? If Tier 1 accounts are not converting at a meaningfully higher rate than Tier 3, your scoring weights are wrong.
Report 2: Missed opportunities. Look at deals that closed-won in the past quarter. What tier would your model have assigned them when they first showed intent? If good deals are consistently landing in Tier 3 or Tier 4, you are missing important signals or underweighting key attributes.
Target benchmarks
These numbers vary by industry and deal size, but directionally:
| Tier | Expected Meeting Rate | Expected Close Rate |
|---|---|---|
| Tier 1 (high fit + high intent) | 15-25% | 5-10% |
| Tier 2 (high fit + medium intent) | 8-15% | 2-5% |
| Tier 3 (nurture) | 3-8% | 1-2% |
| Tier 4-5 (deprioritize) | < 3% | < 1% |
If your Tier 1 meeting rate is below 10%, the model needs tuning. If it is above 20%, you may be too conservative — consider loosening thresholds to capture more volume.
Step 6: Operationalize Into Daily SDR Workflow
A scoring model only creates value if SDRs actually use it. The operational integration matters more than the model sophistication.
The daily workflow
-
Start the day with Tier 1 accounts. These get personalized, research-backed outreach within hours of the signal firing. No templates. Reference the specific behavior — "I noticed your team has been evaluating visitor identification tools" — because these accounts deserve your best effort.
-
Sequence Tier 2 accounts. These get a well-crafted sequence that balances personalization with efficiency. Three to five touches over two weeks, mixing email and LinkedIn.
-
Feed Tier 3 into nurture. Marketing automation handles these — drip campaigns, retargeting, content invitations. When their intent score rises, they automatically promote to Tier 2.
-
Ignore Tier 4-5. This is the hardest part. SDRs are conditioned to prospect broadly. But every minute spent on a low-fit, low-intent account is a minute not spent on Tier 1. Discipline here is what separates quota-hitting teams from the rest.
Weekly calibration
Every Friday, spend 15 minutes reviewing:
- Which Tier 1 accounts converted? Which did not? Why?
- Are any signals consistently over- or under-weighted?
- Has your ICP shifted based on recent wins?
Adjust weights incrementally. Do not overhaul the model based on one bad week.
Common Mistakes to Avoid
Treating all intent signals equally. A pricing page visit is not the same as a blog view. Weight accordingly.
Ignoring negative signals. A company that visited your pricing page, started a trial, and churned after three days should be scored down, not up. Build in negative scoring for churn indicators and competitor-switch signals.
Too many tiers. Three to four actionable tiers is ideal. Five is the maximum. Beyond that, SDRs cannot remember the playbook for each tier and default to treating everything the same.
Not involving SDRs in model design. The people working accounts daily have intuitions about what signals matter that no amount of data analysis will surface. Interview your top performers before setting weights.
Waiting for perfect data. Start with whatever signals you have today — even if it is just website visits and company size. A rough model that SDRs actually use beats a perfect model that lives in a data engineering backlog.
Getting Started Today
You do not need a six-month implementation plan. Here is the minimal viable scoring model you can have running by end of day:
- Export your last 20 closed-won deals. Note company size, industry, and how they first engaged.
- Define 4-5 fit attributes based on patterns in those deals. Assign points.
- List the intent signals you can currently access. Even if it is just website analytics and email engagement, that is enough to start.
- Build the spreadsheet. Use the column structure above. Score your current pipeline.
- Have your SDRs work Tier 1 accounts first for two weeks. Measure meeting rates by tier.
- Iterate. Adjust weights based on what you learn.
Once you outgrow the spreadsheet — and you will — platforms like MarketBetter automate the entire pipeline: visitor identification, multi-source enrichment, account-level signal aggregation, automated scoring with decay, and a prioritized daily work queue for your SDR team. The scoring model you build manually today becomes the logic that runs automatically at scale.
The teams that hit quota consistently are not the ones with the most sophisticated models. They are the ones that have any model at all — and actually use it every morning.
Want to see account scoring and signal intelligence in action? Book a demo and we will show you how MarketBetter prioritizes your total addressable market automatically.