
2 posts tagged with "attribution modeling"

View All Tags

A Guide to Measuring Marketing Effectiveness

· 26 min read

So, what does “measing marketing effectiveness” actually mean?

It’s about figuring out if your marketing is actually doing its job—if it’s hitting your business goals. It's the only way to draw a straight line from what you spend on a campaign to the real money it brings in. Think of it as the ultimate proof that marketing isn't just a cost center, but a revenue driver.

Why Measuring Marketing Effectiveness Matters

A scenic view of a ferry boat on the ocean, a lighthouse on a grassy hill, and a dirt path.

Let's kill a bad idea right now: marketing is not just another line item on a budget. When it’s done right—and measured properly—marketing is the engine for sustainable growth. But without measurement, you’re just guessing. You're spending money and hoping something good happens.

Imagine your marketing strategy is a ship setting sail. Effectiveness isn’t about how fast the ship is moving, which you might track with things like social media likes, ad impressions, or website clicks. Those are vanity metrics. They look impressive on a report, but they don't tell you if you're actually headed in the right direction.

True effectiveness is about whether you’re actually reaching your destination: concrete business goals like more revenue, a bigger slice of the market, and fiercely loyal customers.

Shifting from Activity to Impact

In a world drowning in data, you can't afford to guess anymore. Measuring marketing effectiveness is non-negotiable. It’s the only way to justify your budget, prove your team’s value to the C-suite, and build a tight feedback loop that makes every campaign better than the last. The entire goal is to connect every dollar spent to a tangible business outcome.

Measuring success and allocating budget are two sides of the same coin. In order to make wise budget allocation decisions, we must understand which efforts have been successful and which have not.

This forces a critical conversation about the numbers we choose to watch. Not all metrics are created equal.

Vanity Metrics vs. Business-Impact Metrics

It's easy to get distracted by numbers that feel good but mean very little. Let's compare the two so you can take action and focus on what really moves the needle.

Metric CategoryExamplesWhat It Actually Tells YouActionable Takeaway
Vanity MetricsSocial Media Likes, Impressions, Page ViewsThis shows surface-level activity. It tells you people saw your content, but offers zero insight into whether it changed their behavior or convinced them to buy.Use these as secondary health indicators, but never as your primary measure of success. High impressions with low clicks means your creative or targeting is off.
Business-Impact MetricsCustomer Acquisition Cost (CAC), Return on Ad Spend (ROAS), Customer Lifetime Value (CLV)This directly links your marketing spend to revenue and profit. It tells you if your campaigns are actually generating real, sustainable growth for the business.Make these the headlines of your reports. If ROAS is low, you have a clear mandate: pause the ad, change the offer, or re-evaluate the channel.

See the difference? One makes you feel busy, while the other makes the business money.

The Foundation for Smart Decisions

At the end of the day, a serious commitment to measuring marketing effectiveness lets you answer the big questions. Which channels are bringing in our most profitable customers? How much should we really invest in that new campaign to hit our revenue targets? Which ad copy is actually working?

Without this data, you’re steering the ship with a blindfold on. This guide is your compass. We’re going to move past the surface-level noise and uncover the metrics that signal true business impact and drive smart, forward-thinking decisions.

Choosing the Right KPIs for Your Marketing Goals

So you're convinced that measuring marketing matters. Great. Now comes the hard part: what, exactly, should you be measuring? It’s incredibly easy to get lost in a sea of data, staring at dozens of dashboards that tell you everything and nothing at the same time.

A focused approach is the only way to win. You need to pick the Key Performance Indicators (KPIs) that actually line up with your real business goals. Think of them as your guideposts—the specific numbers that turn a fuzzy objective like "grow the brand" into something you can actually track and improve.

Your KPIs are the turn-by-turn directions on your GPS. Your business goal is the destination. Without the right directions, you're just driving in circles, burning fuel and getting nowhere. Whether you’re trying to build brand awareness, generate high-quality leads, or keep your existing customers happy, your KPIs have to connect directly to that outcome.

Aligning KPIs with Business Objectives

Different goals demand different yardsticks. A campaign designed to get your name out there is going to look very different on a spreadsheet than one built to drive immediate sales. Let's break down how to map the right KPIs to the right job with actionable steps.

  • Goal: Brand Awareness Your mission is to get your brand in front of a wider, relevant audience. Forget just counting impressions—that's a vanity metric. Instead, focus on numbers that suggest people are actually paying attention.

    • Actionable KPIs: Look at social media engagement rate (not just likes), share of voice (how often your brand is mentioned compared to competitors), and tangible increases in direct and branded search traffic.
    • How to Act on It: If branded search traffic is flat, your awareness campaigns aren't memorable enough. It's time to A/B test your core messaging.
  • Goal: Lead Generation Here, we shift from eyeballs to action. Cost Per Lead (CPL) is a classic starting point, but it's dangerously incomplete. A low CPL doesn't mean much if the leads are junk. The real metric to obsess over is the Lead-to-Customer Conversion Rate. This tells you about lead quality.

    • Actionable KPIs: Track CPL, Lead-to-Customer Rate, and Marketing Qualified Leads (MQLs).
    • How to Act on It: Compare the conversion rates from different channels. A channel with a higher CPL but a much higher lead quality is often a better investment. You'd much rather have 10 leads that convert at 50% than 100 leads that convert at a measly 1%.
  • Goal: Customer Retention & Loyalty It's almost always cheaper to keep a customer than to find a new one. To see how you're doing here, you need to be tracking Customer Lifetime Value (CLV), churn rate (the percentage of customers who leave you over a period), and your repeat purchase rate.

    • Actionable KPIs: Monitor CLV, churn, and repeat purchase rate.
    • How to Act on It: If your churn rate ticks up, immediately survey departing customers to find out why. Is it a product issue? A pricing problem? Use that feedback to prevent more customers from leaving.

Practical KPI Comparisons in Action

The "right" KPIs are completely dependent on your business model. A B2B SaaS company and a direct-to-consumer e-commerce brand are playing two totally different sports, even if they're both running digital ads.

Let's compare two scenarios:

Campaign ScenarioB2B SaaS Company (Free Trial Campaign)E-commerce Brand (Holiday Sale)
Primary GoalAcquire qualified product users who will eventually pay.Drive as much revenue as possible in a short, competitive window.
Key KPIs• Trial Signup Rate
Trial-to-Paid Conversion Rate
• Customer Acquisition Cost (CAC)
Return on Ad Spend (ROAS)
• Average Order Value (AOV)
• Conversion Rate
Actionable DecisionIf the Trial-to-Paid Conversion Rate is low, the problem isn't marketing—it's the product onboarding. Time to work with the product team.If ROAS is below your target, immediately reallocate budget from the worst-performing ad set to the best-performing one. Don't wait.

This shows why you need a tailored measurement dashboard. Stop tracking dozens of metrics. Find the handful that give you a crystal-clear, honest view of how you're performing against your specific goals.

Today, digital channels dominate marketing budgets, but measuring their true impact means looking past simple clicks. It's about connecting what you do with what the business earns. It’s no surprise that 89% of top-performing marketers use strategic metrics like gross revenue, market share, and customer lifetime value (CLV) to prove their campaigns work.

When picking your KPIs, understanding the difference between ROI vs ROAS is absolutely critical. ROAS measures the gross revenue you get back for every dollar you spend on ads, while ROI takes all your costs into account to show you the real profit. Getting this right is the key to making smart, sustainable budget decisions.

So, how do you give credit where it’s due?

Imagine this: a customer sees your Facebook ad on Monday, clicks a Google search result on Thursday, and finally pulls the trigger after opening a promo email on Saturday. Which touchpoint gets the high-five for the sale? This is the exact puzzle that marketing attribution solves.

Think of it like a soccer team scoring a goal. The striker who kicks the ball into the net gets the glory, but what about the midfielders who passed it up the field? Or the defender who started the play? Each one played a part. Attribution is just the process of figuring out how much each player contributed.

Without it, you might give all the credit to the last email and slash the budget for the Facebook ad that started the whole journey. Bad move. Good attribution helps you see the entire field, not just the final kick.

From Simple Guesses to Strategic Insights

Attribution models run the gamut from dead-simple to seriously complex. Each one tells a different story about your customer’s path, and picking the right one boils down to your business goals and how long it takes for someone to buy from you. Let's compare the two most basic models.

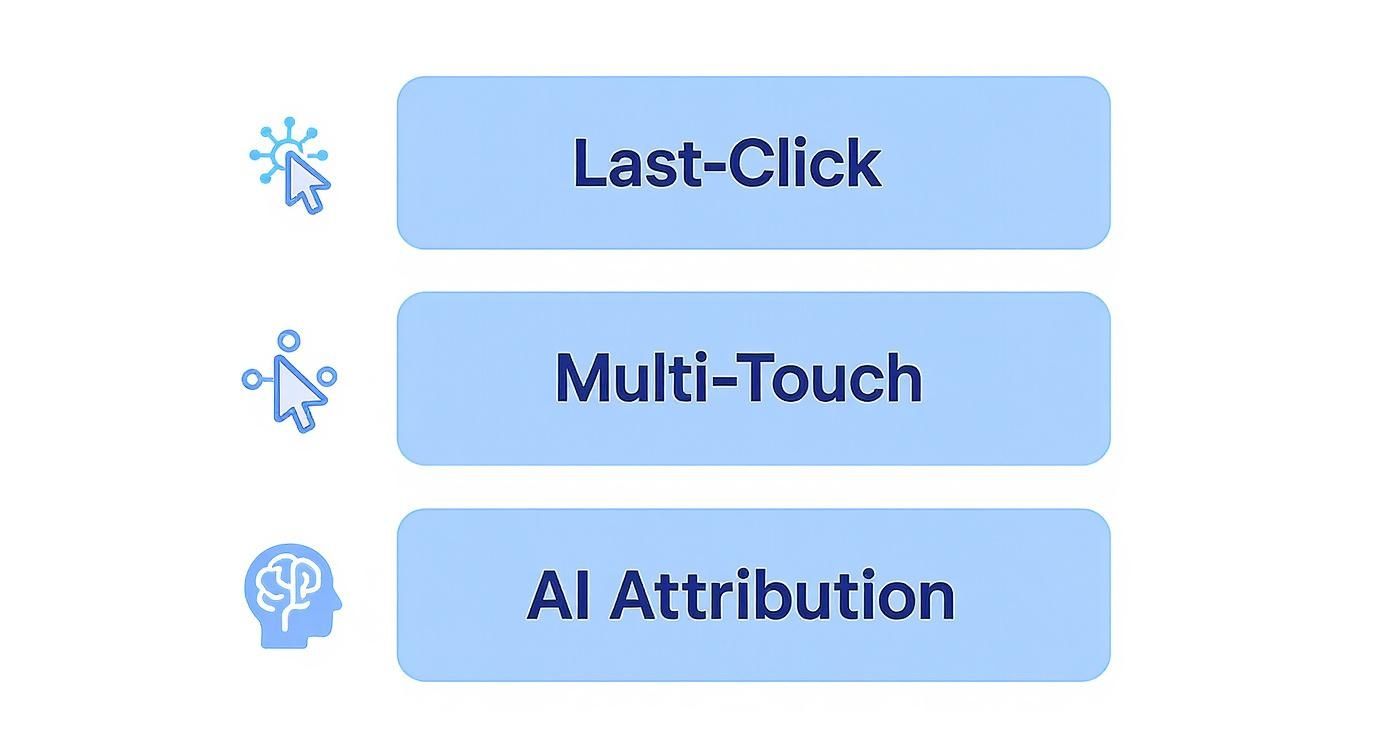
  • First-Touch Attribution: This one’s easy. It gives 100% of the credit to the very first interaction a customer had with you.
    • Actionable Use: Use this model to identify which channels are best at generating initial awareness. If you need to fill the top of your funnel, optimize the channels that win here.
  • Last-Touch Attribution: This is the most common model because it's the easiest to track. It hands 100% of the credit to the final touchpoint right before the conversion.
    • Actionable Use: Perfect for understanding which channels are your best "closers." If you need to boost end-of-quarter sales, double down on the channels that score high with last-touch.

But here’s the catch: both of these single-touch models have tunnel vision. They completely ignore everything that happens in the middle of the journey—which, let's be honest, is often where the real magic happens.

Attribution isn't just about counting clicks; it's about understanding influence. The real goal is to see the complete picture of how all your channels work together to turn a stranger into a customer.

The Power of Multi-Touch Attribution

If you’re not selling impulse-buy items, you need a clearer view. For businesses with longer sales cycles, multi-touch attribution provides a much more balanced and accurate picture of what’s actually working. These models spread the credit across multiple touchpoints, acknowledging the reality that most sales are the result of a series of nudges, not a single tap.

This decision tree helps visualize how different goals—like building awareness, generating leads, or driving sales—demand different ways of measuring success.

A decision tree diagram showing marketing effectiveness, starting with START, branching into Awareness, Leads, and Sales.

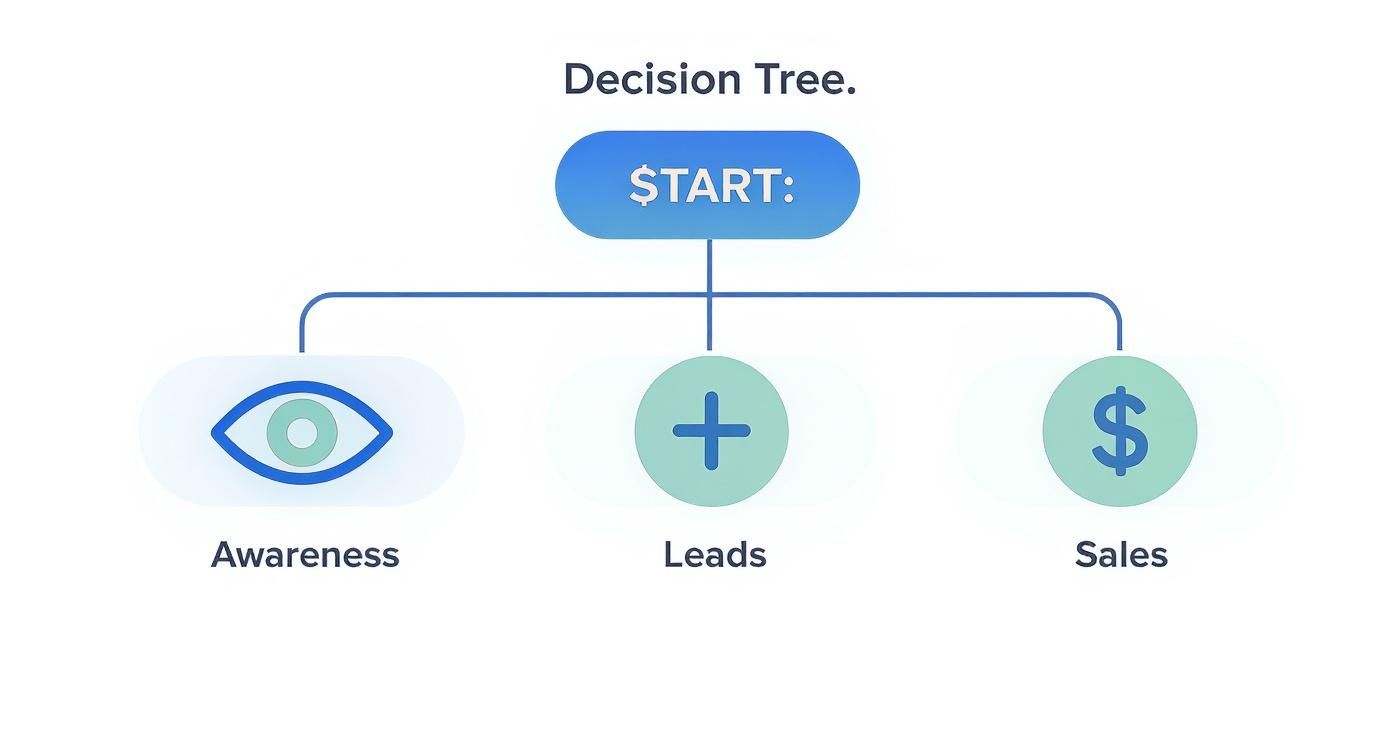
As you can see, your main business objective points you down a specific measurement path, making sure you’re tracking the right numbers at every stage of the funnel.

Which Marketing Attribution Model Is Right for You?

Choosing the right model is a big deal. It dictates where you put your budget and how you measure your team's success. To help you figure out what fits, here's a quick comparison of the most common multi-touch models. Each one offers a unique lens through which to view your customer journey.

Attribution ModelHow It WorksBest ForActionable Insight
LinearSpreads credit evenly across every single touchpoint. A simple, democratic approach.B2B companies with long sales cycles where every interaction plays a role in nurturing the lead.Reveals your "workhorse" channels that consistently contribute across the entire journey, even if they don't open or close the deal.
Time-DecayGives more credit to the interactions that happened closer to the sale.Short-term promotional campaigns or B2C sales cycles where recent touchpoints are most influential.Helps you optimize the final steps of the buyer journey by highlighting what nudges people over the finish line.
U-ShapedGives 40% credit to the first touch, 40% to the last, and divides the remaining 20% among the middle touches.Businesses that highly value both lead generation (the first touch) and conversion (the last touch).If a channel appears often in the middle but gets little credit, it might be a great nurturing channel that you're undervaluing.

At the end of the day, there’s no single "best" model that works for everyone. The right choice is the one that best reflects how your customers actually buy. An e-commerce brand with a three-day sales cycle might be perfectly fine with a Last-Touch or Time-Decay model. But a B2B software company with a six-month sales process? They’d get far more truth from a Linear or U-Shaped model.

For a deeper dive into these frameworks, check out our complete guide to multi-touch attribution models.

Advanced Measurement Frameworks for a Holistic View

Attribution models are fantastic, but they're starting to tell an incomplete story. In a world where privacy rules are getting tighter and third-party cookies are disappearing, leaning entirely on user-level tracking is becoming a risky bet. It’s time to zoom out and bring in frameworks that give you the full, top-down picture of what’s really working.

Think of digital attribution like tracking individual plays in a football game—it shows you who passed the ball and who scored. That's crucial stuff. But these advanced frameworks are like the post-game analysis from the skybox, revealing how things like weather, crowd noise, and even team morale influenced the final score. You absolutely need both perspectives to understand what truly drives a win.

These broader methods help you measure the stuff that’s historically been a black box, like the real impact of a billboard or a TV ad, and see how all your marketing efforts sing together.

Marketing Mix Modeling: The Privacy-First Powerhouse

One of the most powerful top-down approaches is Marketing Mix Modeling (MMM). At its core, this is a statistical method that digs through your historical data—sales numbers, ad spend across every single channel, and even external factors—to measure how much each piece contributed to your revenue.

Instead of tracking individuals, MMM looks at aggregated data over time. It’s built to answer the big, strategic questions like, "For every dollar we put into YouTube ads last quarter, how many dollars in sales did we actually get back?" It also cleverly accounts for all the real-world variables that attribution models completely ignore, such as:

  • Seasonality: How do holiday rushes or summer slumps really affect our sales?
  • Promotions: What was the actual sales lift from our 20% off sale, beyond what we would have sold anyway?
  • Competitor Actions: Did our rival's massive new ad campaign put a dent in our performance?
  • Economic Trends: How is something like inflation impacting what our customers are willing to spend?

This kind of analysis is becoming non-negotiable as old-school digital attribution hits a wall. A recent EMARKETER study found that over 61% of marketers are actively trying to improve their measurement with better and faster MMM solutions. That’s a huge signal that the industry is shifting. You can dive deeper into the latest measurement trends and find more great insights over at Analytic Edge.

Incrementality Testing: Uncovering True Causal Impact

While MMM gives you that crucial 30,000-foot view, Incrementality Testing is all about answering a much more direct question: did my marketing campaign cause an increase in sales that wouldn't have happened otherwise? It’s designed to isolate the true "lift" your ads generated.

The most common way to do this is with a classic A/B test or a lift study. Here’s the simple version: you split your target audience into two groups. The "test group" sees your ad, while the "control group" doesn't. By comparing the conversion rates between the two, you can measure the real, causal impact of that specific campaign.

Incrementality moves you beyond correlation to pure causation. It’s the difference between knowing sales went up while your ad was running, and knowing sales went up because your ad was running.

This is the gold standard for proving the worth of channels that are notoriously tough to measure with last-click attribution, like brand awareness campaigns on social media or video platforms.

Combining Frameworks for a 360-Degree View

So, which one is right for you: attribution, MMM, or incrementality? The real answer is, you need all three. They aren't competing with each other; they're answering different questions at different altitudes, giving you a complete measurement toolkit.

Here’s a comparison of how to put them into action:

Measurement FrameworkPrimary Question AnsweredActionable Use CaseKey Limitation
Attribution ModelingWhich touchpoints deserve credit for a specific conversion?Use daily to tweak bids in Google Ads or optimize creative in your social campaigns for better immediate performance.Struggles with offline channels and is increasingly hamstrung by data privacy.
Marketing Mix Modeling (MMM)How did my total marketing budget and outside factors impact overall sales?Use quarterly for high-level budget planning. Decide if you should shift 10% of your budget from paid search to connected TV next year.Less granular and slower to produce insights compared to digital attribution.
Incrementality TestingDid this specific campaign cause a real lift in conversions?Use for major campaign launches to prove the real value of a new channel or strategy before you scale the budget.Can be complex and expensive to run for every single marketing activity you do.

When you weave these frameworks together, you create a powerful, multi-layered measurement strategy. Use MMM for your high-level budget planning, attribution for the daily grind of digital optimization, and incrementality tests to validate the true impact of your most important campaigns. This integrated approach is how you finally get that holistic view of your marketing effectiveness you've been looking for.

Common Measurement Pitfalls and How to Avoid Them

A desk with a laptop, measuring tape, and blueprints, and a sign saying 'AVOID PITFALLS' in the background.

Even with the slickest frameworks and best intentions, it's dangerously easy to fall into a few classic measurement traps. These aren't just small errors; they're the kinds of mistakes that warp your perception of what's working, leading you to pour money into the wrong channels and starve the ones that are actually driving growth.

Good measurement isn't about getting a number—it's about getting the right number. It's about finding the truth. Let's walk through the most common blunders marketers make and, more importantly, how you can sidestep them.

Confusing Correlation with Causation

This is the big one. It's the oldest trap in the book. You launch a new social media campaign, and sales go up. The campaign must have worked, right?

Not so fast. Maybe a competitor fumbled their inventory. Maybe a good news story about your industry created a halo effect. Correlation just means two things happened around the same time. Causation means one thing made the other happen.

How to Fix It: Stop guessing and start proving. Run incrementality tests (like an A/B test) to isolate the true impact of a campaign.

  • Actionable Step: For your next big Facebook campaign, work with their platform to run a brand lift study. Show your ads to a test group but hold them back from a control group. The difference in their behavior is the real, causal lift your marketing generated.

"The goal is to move beyond observing what happened and start proving what you made happen. That shift from correlation to causation is where true measurement confidence is born."

Getting Trapped by Data Silos

Your customer data is everywhere. It’s in Google Analytics, your CRM, social ad platforms, your email tool—a dozen different systems that don't talk to each other. This creates a horribly fragmented view of the customer journey. You see a new lead pop up in Salesforce, but you have no clue which ad, blog post, or email chain brought them there.

This isn’t just messy; it’s misleading. Nielsen data famously revealed that while marketers often rank radio near the bottom for performance, it frequently delivers some of the highest ROI. Why the disconnect? Because last-click attribution on digital channels is easy to see, so we overvalue it and ignore the bigger picture. You can see more of these surprising ROI findings on Nielsen.com.

Overvaluing Short-Term Wins

Metrics like Cost Per Click (CPC) and daily sign-ups are addictive. They give you that instant hit of feedback. But focusing only on these short-term numbers can trick you into killing your most valuable long-term plays.

A top-of-funnel brand campaign isn't meant to drive a sale today. Its job is to build the awareness and trust that fuels all of your other channels tomorrow. If you judge it by immediate conversions, you’ll always conclude it's a failure and cut the budget, kneecapping your future growth.

How to Fix It: Use a balanced scorecard. Judge each marketing activity by its actual goal.

  • Actionable Comparison:
    • Brand Building (e.g., YouTube Pre-Roll): Track things like share of voice, branded search volume, and social engagement. Goal: Increase branded search by 15% this quarter.
    • Direct Response (e.g., Google Search Ad): Here you can focus on ROAS, CPA, and immediate conversion rates. Goal: Achieve a 4:1 ROAS on this campaign.

Ignoring the Offline World

This is a huge blind spot for digital-first teams: if it doesn't have a tracking pixel, it didn't happen. That thinking can be catastrophic.

Imagine you run a podcast sponsorship that’s absolutely killing it. But because your attribution model can't connect listens to purchases, it looks like a zero on your dashboard. So you cut it. You just killed a high-performing channel because it didn't fit into your neat, pixel-based world.

How to Fix It: Get creative with bridging the offline-to-online gap.

  • Actionable Step: For your next podcast ad, use a unique promo code (PODCAST20) and a vanity URL (yoursite.com/podcast). Ask "How did you hear about us?" in your checkout form. Compare the data from all three sources to get a much truer picture of the campaign's impact.

The Future of Marketing Measurement with AI

The frameworks we've covered are solid, but the next chapter in measuring marketing is already being written, and the author is Artificial Intelligence. AI is taking measurement from a backward-looking chore to a forward-looking strategic weapon. It’s making the whole process smarter, faster, and more predictive than ever before.

Imagine running a complex Marketing Mix Model (MMM) not at the end of a quarter, but almost in real-time. That's the kind of power AI puts on the table. AI-powered platforms can chew through colossal datasets to automate analyses that once took data science teams weeks to finish, handing you insights at the speed you actually need them.

This isn't a small tweak. It fundamentally changes how marketers work.

From Reporting to Predicting

The old way of doing things is looking at last month's report to figure out what broke. AI flips that script completely. The game is shifting from reacting to past performance to proactively shaping future outcomes. We're no longer just asking what happened, but what will happen next.

This is possible because AI is a master at spotting patterns and forecasting what comes next. The future of measurement will lean heavily on predictive modeling techniques supercharged by AI, allowing us to anticipate trends with startling accuracy. Marketers can now make calls based not just on history, but on probable futures.

AI doesn't just show you a dashboard of the past; it gives you a roadmap for the future. It’s the difference between looking in the rearview mirror and having a GPS that sees traffic jams before you hit them.

Actionable AI-Powered Optimization

The real magic of AI in marketing measurement isn't just the data—it's the ability to deliver clear, actionable recommendations. It’s about decision intelligence.

Here’s a practical comparison of the old way vs. the AI way:

TaskOld Way (Manual & Reactive)AI Way (Automated & Proactive)
Budget AllocationYou spend hours in spreadsheets trying to guess the best mix for next quarter based on last quarter's data.Before you spend a dollar, AI runs thousands of budget scenarios to show you the likely ROI of shifting 15% of spend from paid search to Connected TV.
Campaign OptimizationYou notice at the end of the week that a social media campaign's CPA has climbed. You pause it after the money is already spent.AI monitors your campaigns in real-time, spots the underperforming ad, and pings you with a recommendation to reallocate funds to a rising star before you waste more budget.

At the end of the day, AI isn’t here to replace the marketer. It's the indispensable partner we’ve been waiting for. It handles the heavy computational lifting, freeing up human minds to focus on what we do best: creativity, brand storytelling, and high-level strategy. By automating complex measurement and offering predictive insights, AI empowers us to make truly intelligent, data-backed decisions that drive real business growth. Learn more about how you can get ahead with our guide to predictive analytics in marketing.

A Few Common Questions We Hear

Even with the best game plan, the real world throws curveballs. Once you start digging into the numbers, practical questions pop up fast. Here are a few of the most common hurdles marketers face, along with some straight talk on how to clear them.

"How in the world do I measure my radio ads or print campaigns?"

Measuring offline marketing can feel like shouting into the void and hoping for the best. But you don't have to guess. The trick is to build a simple, trackable bridge from the physical world to your digital one.

The goal is to give people a unique path to follow. For example, a radio ad could mention a specific URL like yoursite.com/radio that you don't link to anywhere else. Anyone who lands there came from that ad. Simple.

Here’s a comparison of ineffective vs. actionable tracking methods:

The Old Way (Low Visibility)The Smart Way (High Visibility)
Running a generic ad and hoping for a sales bump.Using a unique promo code (RADIO20) so you can directly attribute sales.
Putting your main phone number on a billboard.Setting up a dedicated, trackable phone number just for that billboard campaign.
Just telling people to visit your homepage.Adding a QR code that sends them to a specific, measurable landing page.

By creating these dedicated pathways, you're making the invisible impact of your offline channels show up loud and clear in your analytics.

"I have a small team and an even smaller budget. Where do I even start?"

You don't need a massive budget or a data science team to get this right. In fact, trying to track everything at once is the fastest way to get overwhelmed and do nothing. The key is ruthless focus.

Start with the basics. Google Analytics 4 is free and an absolute powerhouse for understanding your website traffic and what people are doing there. It's your ground zero.

The most important first step? Define your one, single, most critical conversion. Is it a purchase? A demo request? A newsletter signup? Whatever it is, focus all your energy on tracking that one action flawlessly before you do anything else.

Once that’s locked in, you can start layering on other metrics. But for a small team, victory comes from nailing the essentials, not from building a dashboard that looks like a spaceship cockpit.

"What’s more important to track—brand awareness or lead generation?"

This is the classic marketing tug-of-war, but it’s a false choice. You don't pick one. You measure both, but you measure them differently, with different yardsticks. Judging a brand campaign by how many leads it generated today is like judging a fish by its ability to climb a tree.

It's much smarter to create two separate scorecards.

  • Actionable Plan for Brand Awareness: Keep an eye on things like branded search volume (are more people Googling your name?), social media engagement, and direct traffic. Set a quarterly goal to increase branded search queries by 10%.
  • Actionable Plan for Lead Generation: This is where you get clinical. Track the hard numbers: Cost Per Lead (CPL), Lead-to-Customer Conversion Rate, and, of course, Return on Ad Spend (ROAS). Set a monthly goal to keep your CPL below $50.

A healthy marketing engine needs both. Your brand-building efforts fill the top of your funnel, which makes all your lead generation work down the line cheaper and far more effective. They work together.


Stop guessing and start optimizing. marketbetter.ai uses AI to connect your marketing spend to real revenue, giving you the clarity to make smarter budget decisions and prove your impact. Discover how our AI-powered platform can transform your marketing measurement.

How to Measure Marketing Effectiveness

· 27 min read

Figuring out if your marketing is actually working means tying what you do every day to real business results, like revenue and new customers. It’s about getting past the fluffy, surface-level numbers to see which strategies are pulling their weight. This is how you optimize your budget and prove your team's value. It all comes down to setting clear goals, picking the right metrics, and using a smart framework to turn data into decisions.

Building Your Marketing Measurement Framework

Image

Before you can measure anything accurately, you need a game plan. Think of a measurement framework as your blueprint—it ensures every single thing you do is intentional and connected to the big-picture business goals. Without one, you’re just collecting random data points that don't tell a story. With one, you're building a system to make better decisions.

The first step? Stop chasing vanity metrics. A post with 10,000 likes that generates zero leads is a failure compared to a targeted article that only brings in 50 qualified leads who actually convert. The actionable insight here is to shift your focus from metrics that feel good (likes) to metrics that drive growth (qualified leads). That’s the difference between activity and impact.

Get Aligned With Stakeholders on What "Success" Means

Your framework is useless if nobody agrees on the definition of success. The metrics that get you excited might not be the same ones your CEO or head of sales cares about. They’re thinking in terms of revenue, customer growth, and market share. Your job is to translate your marketing performance into their language.

Here's an actionable plan to get aligned: schedule a 30-minute meeting with key stakeholders and ask direct questions.

  • For your CEO: "What is the single most critical business goal for us this quarter? Is it pure customer acquisition, breaking into a new market, or boosting customer lifetime value?" This helps you anchor your KPIs to top-line business objectives.
  • For the Head of Sales: "Can we define exactly what a 'qualified lead' is for your team? What criteria must they meet?" This prevents you from delivering leads that the sales team rejects, ensuring your efforts are valued.
  • For the Product Team: "Which features are we pushing right now, and how can marketing help with user adoption and getting feedback?" This aligns your campaigns with the product roadmap.

Having these conversations upfront prevents painful misalignment later. It allows you to build a framework that directly supports company-wide objectives, making it way easier to show how your department is moving the needle.

Pick the Right Metrics for Each Stage of the Funnel

A good measurement framework tells the whole story, from the first time a prospect hears about you all the way to their purchase. This means you need specific KPIs for each stage of the customer journey, not just the final conversion. It’s like a relay race—each stage hands off to the next, and a weak link anywhere in the chain messes up the final result.

A classic mistake is getting obsessed with last-touch attribution, which gives 100% of the credit to the final ad someone clicked. A smart framework recognizes that the blog post they read last month, the social video they watched last week, and the webinar they attended yesterday all played a part.

Let's compare how you'd measure success for different channels at each stage:

  • Top-of-Funnel (Awareness): For a LinkedIn brand campaign, you might track Impressions and Share of Voice. A better, more actionable metric is qualified reach—are the right people seeing your content? Compare this to an SEO-driven blog, where you’d measure Organic Traffic and Keyword Rankings for high-intent terms.
  • Middle-of-Funnel (Consideration): A webinar’s performance is judged by its Registration Rate and Attendee Engagement. But to make this actionable, track how many attendees ask questions or respond to polls. Compare this to an ebook's success, which is all about its Landing Page Conversion Rate and the Quality of Leads it generates (i.e., how many become MQLs).
  • Bottom-of-Funnel (Conversion): For a Google Ads campaign, the most important metric is Cost Per Acquisition (CPA). For a final-push email sequence, compare the Click-Through Rate on "Book a Demo" links to the ultimate Sales Conversion Rate. If CTR is high but conversions are low, the issue is on the landing page, not the email.

By building this kind of balanced scorecard, you avoid the trap of calling a top-of-funnel campaign a "failure" just because it didn't drive sales directly. That wasn't its job. Its job was to fill the pipeline, and your framework should prove it did just that. For a deeper dive into setting up a solid foundation for tracking your efforts, check out this modern guide for impactful marketing. This approach helps you build a clear, defensible story about how every marketing dollar contributes to the bottom line.

Choosing The Right Marketing Metrics And KPIs

Image

Alright, you've got your strategy sketched out. Now comes the hard part: cutting through the noise. It’s incredibly easy to get buried in a mountain of data, staring at charts that go up and to the right without actually telling you if you're growing the business.

Effective measurement isn't about tracking everything. It’s about being ruthless and focusing only on the numbers that signal real business momentum, not just marketing activity. A spike in website traffic is a classic vanity metric. It feels good, but it means nothing if none of those visitors are the right people.

The goal is to connect every single metric you track back to a tangible business outcome. You need to tell a story with your data—a story that ends with marketing’s direct contribution to the bottom line.

Aligning Metrics To The Marketing Funnel

You wouldn't judge a sprinter on their marathon time, right? The same logic applies here. Different stages of the customer journey demand different yardsticks. One of the most common mistakes I see is teams judging an awareness campaign by its direct sales impact. It’s a recipe for killing good campaigns before they have a chance to work.

Think of your funnel metrics as a diagnostic tool. If conversions are tanking, a funnel-based view lets you look upstream. Is the problem weak leads coming from the middle of the funnel? Or is it that you just aren't getting enough eyeballs at the top?

Let's walk through what this looks like in practice, comparing standard metrics to more insightful ones:

  • Awareness Stage (Top of Funnel): Instead of just tracking Impressions (how many times your content was seen), a much sharper metric is Share of Voice (SOV). It answers a better question: "How much of the conversation in our market do we actually own compared to our competitors?" This gives you a competitive benchmark.

  • Consideration Stage (Middle of Funnel): Click-Through Rate (CTR) is a solid indicator that your creative and messaging are hitting the mark. But a more holistic metric is Engagement Rate (likes, shares, comments). It tells you if your content is truly resonating, not just getting a passing click. Actionable insight: high engagement but low CTR means your content is good, but your call-to-action is weak.

  • Conversion Stage (Bottom of Funnel): Conversion Rate is your bread and butter—it’s the percentage of people who take the action you want them to. But the real gut-check metric is Cost Per Acquisition (CPA). It tells you exactly how much you're spending to get one new customer, making it a direct line to campaign efficiency and profitability. Compare the CPA across different channels to decide where to allocate your budget.

To make this even clearer, here's a quick reference table breaking down the essential KPIs for each stage of the journey.

Key Marketing Metrics by Funnel Stage

Tracking the right metrics at each stage gives you a clear, actionable picture of your marketing performance, from initial brand exposure to the final conversion.

Funnel StageMetric/KPIWhat It MeasuresExample Tool
AwarenessImpressionsTotal times content is displayed.Google Ads
AwarenessShare of Voice (SOV)Your brand's visibility vs. competitors.Brandwatch
ConsiderationClick-Through Rate (CTR)Percentage of impressions that result in a click.HubSpot
ConsiderationEngagement RateLikes, shares, comments as a % of audience.Sprout Social
ConversionConversion RatePercentage of users who complete a desired action.Google Analytics
ConversionCost Per Acquisition (CPA)The total cost to acquire a single new customer.Salesforce

Using this framework helps you pinpoint weaknesses and double down on what’s working, ensuring your entire marketing engine is firing on all cylinders.

The Business-Level Metrics Executives Actually Care About

While funnel metrics are your day-to-day guide for optimizing campaigns, the C-suite speaks a different language. They're focused on growth, profitability, and the long-term health of the business. To earn their trust (and bigger budgets), you need to translate your marketing efforts into their language.

The most effective marketers don't just report on clicks and leads; they demonstrate how marketing drives the core financial health of the business. This is how you get a seat at the strategic table.

Two numbers matter more than almost any others here: Customer Acquisition Cost (CAC) and Customer Lifetime Value (CLV).

  • Customer Acquisition Cost (CAC): This is the total sales and marketing spend it takes to land a single new customer over a specific time. You calculate it by dividing all your acquisition costs by the number of new customers you brought in. No hiding here—it's the true cost of growth.

  • Customer Lifetime Value (CLV): This is a prediction of the total net profit you'll get from a customer over their entire relationship with you. It’s about their long-term worth, not just their first purchase.

The real power move is comparing these two. The CLV:CAC ratio is your ultimate proof point for sustainable marketing. A healthy ratio, typically 3:1 or higher, is a clear signal that you're acquiring customers who generate far more value than they cost to win. Understanding how to calculate ROI to prove investment value is non-negotiable for justifying your spend.

This isn’t just about reporting, either. It directly shapes your strategy. Actionable step: calculate the CLV for customers acquired from different channels. If you discover that leads from your webinar series have a sky-high CLV compared to those from paid social, you can confidently shift budget away from lower-performing channels and double down on webinars. This is also where AI can give you a massive edge, helping you qualify leads better and focus your team's energy only on high-value prospects. We dive deep into that topic in our guide on how to use AI for better lead scoring.

So you’ve got your KPIs locked in. The next question is the one that sparks endless debate in marketing meetings: who gets the credit? A customer might see a Facebook ad, read a couple of blog posts, open an email, and then finally click a Google Ad before they buy. Which one of those channels actually did the work? This is the classic attribution problem, and it’s where a lot of marketers get stuck trying to prove their budget is well-spent.

Attribution modeling is just a fancy term for a set of rules that assign value to the different touchpoints in that messy customer journey. If you get it right, you can confidently measure what’s working. But if you choose the wrong model, you might end up cutting the budget for a channel that’s quietly doing all the heavy lifting at the start of the journey.

Comparing Single-Touch vs. Multi-Touch Models

The simplest models are single-touch, which give 100% of the conversion credit to just one interaction. They're easy to set up but can be dangerously misleading because they only show you a tiny sliver of a much bigger picture. In contrast, multi-touch models distribute credit, offering a more realistic view.

Let's compare the common single-touch models:

  • First-Touch Attribution: This model gives all the credit to the very first interaction. It’s useful if your main goal is driving top-of-funnel awareness. The problem? It completely ignores everything that happened afterward to actually nurture that lead and convince them to buy. Actionable Use: Use this model to identify your best "introducer" channels.
  • Last-Touch Attribution: This is the default setting in a lot of analytics platforms. It gives all the credit to the final touchpoint right before the conversion. It’s great for figuring out which channels are your best "closers," but it gives zero value to the channels that introduced and educated the customer in the first place. Actionable Use: Use this model to optimize your bottom-of-funnel conversion campaigns.

Relying on these is like giving all the credit for a championship win to the person who scored the final goal, ignoring the assists, the defense, and the coaching. For a more accurate view, you have to look at multi-touch attribution.

Multi-touch models get that modern customer journeys aren't a straight line. They distribute credit across multiple touchpoints, giving you a far more balanced and realistic understanding of what’s actually driving results.

A Deeper Look at Multi-Touch Attribution

Multi-touch models give you a more nuanced view by assigning partial credit to different interactions along the path. Yes, they’re more complex, but the insights they generate are gold for making smart budget decisions.

Here’s a breakdown of the most common multi-touch models and where they shine:

Attribution ModelHow It WorksBest Used When...
LinearGives equal credit to every single touchpoint in the journey.You want a simple, balanced view and value every interaction equally, which is common for long B2B sales cycles.
Time-DecayGives more credit to touchpoints that happened closer to the conversion.The consideration phase is short, and recent interactions are genuinely more influential, like during a flash sale.
Position-BasedGives 40% credit to the first touch, 40% to the last touch, and the remaining 20% is split among the middle touches.You value both the channel that hooked them and the channel that closed them the most. This is a common and balanced approach for many businesses.

Picking the right model really depends on your business and how long it takes for a customer to decide. A B2B company with a six-month sales cycle might lean toward a Linear model, while an e-commerce brand could get more value from a Position-Based or Time-Decay model.

Actionable Step: Don't just pick one model and stick with it. In your analytics tool (like GA4), compare the results from 2-3 different models. Does your content marketing look more valuable under a Linear model than a Last-Touch model? This comparison itself is a powerful insight. Of course, this requires solid tracking, which our guide to understanding person-level identification can help you nail down.

The Rise of Marketing Mix Modeling in a Privacy-First World

With privacy rules getting stricter and third-party cookies going away, tracking individual users is getting a lot harder. This is where Marketing Mix Modeling (MMM) is making a comeback. Instead of following individual users, MMM uses statistical analysis on big-picture data—like channel spend, sales revenue, and even external factors like seasonality—to measure the impact of each marketing channel.

This visual lays out the foundational steps for any good measurement strategy, starting with identifying your data sources and ensuring everything is tracked correctly.

Image

This process is the bedrock for MMM, which needs high-quality, aggregated data to deliver trustworthy insights on channel performance.

MMM became the talk of the town again after privacy updates like Apple's App Tracking Transparency in 2021 made user-level attribution a nightmare. Now, many see it as the 'new gold standard' for measurement. It helps you answer the big questions like, "For every dollar we spend on TV ads, how much incremental revenue do we generate?"—all without needing to track a single cookie.

Using AI to Find Insights That Actually Matter

Let's be honest. Traditional analytics are like a rearview mirror—they tell you exactly what you just passed. That’s useful, but it won’t help you navigate what’s ahead. AI analytics, in comparison, are like a GPS with live traffic data. They don't just show you the map; they predict the traffic jams and suggest faster routes. This is the biggest shift in marketing measurement today: moving from simply reporting on what happened to proactively shaping what happens next.

Forget spending hours in spreadsheets trying to connect the dots. Modern AI tools chew through massive datasets in seconds. They spot the subtle customer behaviors your team would miss, predict which campaigns will actually hit their numbers, and automate the kind of deep analysis that used to take weeks.

This isn't just about efficiency. It's about getting a real, sustainable edge on the competition. The whole game is changing, thanks to a mix of new tech, economic pressures, and privacy rules. According to the Marketing Effectiveness Trends 2025 report by ScanmarQED, AI is now central to everything from personalizing content to forecasting ROI with startling accuracy.

Finding the "Why" Behind the "What"

One of the most valuable things AI does is find connections humans can't easily see. By looking at actual behavior—what people click, how long they stay, which content they consume—AI builds customer segments based on what they do, not just who they are. This goes so much deeper than old-school personas.

An AI tool might surface a segment it calls "high-intent researchers." These aren't just VPs of Marketing from tech companies. These are the specific people who read three of your technical blog posts, watched 75% of a product demo, and visited your pricing page twice this week.

AI isn't just grouping people together. It’s identifying the exact sequence of micro-actions that scream "I'm ready to buy." This lets you stop guessing and start focusing your best efforts on your highest-value prospects with laser precision.

This completely changes how you measure success. You move from asking, "Did our email campaign get a good open rate?" to "Did our email campaign successfully nudge our 'high-intent researchers' into booking a demo?" It shifts the focus from vanity metrics to real business impact.

Platforms like Salesforce use AI to pull all these disparate data points into a single, unified view of the customer, making these kinds of insights accessible. It's about seeing the entire journey, not just isolated touchpoints.

This kind of dashboard isn't just a pretty picture; it’s a command center that shows how AI is connecting every interaction to build an intelligent profile you can act on.

Trading Yesterday's Reports for Tomorrow's Forecasts

This is where things get really interesting. Predictive analytics uses your past performance data to forecast what's likely to happen next. Instead of waiting for a campaign to end to see if you hit your cost-per-acquisition (CPA) goal, a predictive model can tell you what your CPA is likely to be after just a few days of data.

It’s a fundamental shift from reactive to proactive. Let's compare the two approaches:

TaskThe Old Way (Reactive)The AI Way (Proactive)
Budget AllocationBased on what worked last quarter.Reallocated in real-time to channels predicted to have the highest ROI this week.
Lead ScoringStatic points system based on job title and company size.A dynamic score that changes based on a lead's real-time website behavior.
Content StrategyWriting about topics you think your audience wants.Creating content on topics AI has identified as having high engagement potential with your target segments.

This means you can optimize campaigns while they're still running. Actionable Step: If an AI tool predicts a specific ad set is on a path to fail, you can pull the plug and move that budget to a winner before you've wasted thousands of dollars. It’s about making smarter decisions, faster.

Think about an e-commerce company. An AI model could identify customers at a high risk of churning based on their recent purchasing and browsing behavior. That model flags the accounts, triggering a targeted retention campaign with a special offer—before they actually leave. That's a direct line from a marketing action to saving revenue.

A huge part of this is digging into the content they engage with. If you want to get better at that, our guide on leveraging AI for smarter content analysis is a great place to start.

Turning Analysis Into Actionable Campaign Improvements

Image

All the frameworks, KPIs, and attribution models in the world are just theory until you use them to make your marketing better. Measurement is meaningless without action. This is where you close the loop—turning raw numbers into smarter decisions that actually drive growth.

Successfully measuring marketing isn't a one-and-done project. It's a continuous rhythm of reviewing, testing, and refining. You're building a system where data doesn't just sit in a dashboard but actively fuels your next move.

It all comes down to diagnosing what’s working, understanding why, and then systematically improving your strategy based on hard evidence, not just gut feelings.

Establishing a Rhythm for Performance Reviews

To make data-driven decisions a habit, you need to get a consistent review schedule on the calendar. Sporadic check-ins lead to missed opportunities and reactive firefighting. A structured approach ensures you’re always on top of what’s happening.

Here's an actionable cadence you can implement today:

  • Weekly Tactical Check-ins: These are quick, 30-minute huddles focused on campaign-level metrics. You’re looking for immediate red flags or quick wins. Is a specific ad’s Cost Per Click (CPC) suddenly spiking? Can we shift budget to a high-performing social post? Keep it fast and actionable.
  • Monthly Strategic Reviews: This is a deeper dive into channel performance and how you’re tracking toward quarterly goals. Are we on track to hit our MQL target? How is our SEO traffic growth trending month-over-month? This is where you connect the dots between tactics and strategy.
  • Quarterly Business Reviews: Here, you zoom all the way out and connect marketing efforts directly to business outcomes. You'll be presenting your CLV:CAC ratio, overall marketing ROI, and contribution to the sales pipeline to stakeholders. It's about showing real business impact.

This tiered approach keeps everyone aligned without causing data overload. The goal is to make these meetings about insight and action, not just reading numbers off a screen.

Designing Tests That Deliver Clear Answers

The fastest way to improve is to test. But unfocused testing is just as wasteful as not testing at all. To get real answers, you need to be deliberate about what you're trying to learn. The two most common methods are A/B testing and multivariate testing.

A/B testing is your go-to for a clean, simple, and direct comparison between two versions of a single element. You get a clear winner. For example, you might test two different email subject lines to see which one gets a higher open rate.

Multivariate testing, on the other hand, is for when you want to test multiple changes at once to see which combination performs best. You could test two headlines, two images, and two calls-to-action all at the same time on one landing page. This is way more complex and requires a ton of traffic to get statistically significant results, but it can uncover powerful interaction effects between elements you’d never have spotted otherwise.

Don’t just test for the sake of testing. Start with a clear hypothesis. Something like: "I believe that changing the CTA button color from blue to orange will increase the landing page conversion rate because orange creates a stronger visual contrast." This transforms a random guess into a scientific experiment.

Here’s a quick comparison to help you choose the right approach for your needs.

A/B Testing vs. Multivariate Testing Comparison

Deciding between these two really just depends on your goal, how much traffic you have, and how quickly you need an answer.

AspectA/B TestingMultivariate Testing
Primary GoalTo determine which of two versions of a single element performs better (e.g., Headline A vs. Headline B).To determine which combination of multiple elements performs best (e.g., Headline A + Image B + CTA C).
ComplexitySimple to set up and analyze.More complex, as it tests multiple variables and their interactions simultaneously.
Traffic RequiredLower. You can get statistically significant results with less traffic since you're only comparing two versions.Much higher. It needs enough traffic to test every possible combination of elements effectively.
Best ForOptimizing specific, high-impact elements like CTAs, subject lines, or hero images for quick wins.A full redesign or overhaul of a key page, like a pricing page or homepage, where many elements are changing.

For most teams, starting with a series of simple A/B tests is the most practical way to build momentum and see immediate results. Once you’re in a good rhythm, you can explore more complex multivariate tests on your highest-traffic pages.

Diagnosing Performance and Refining Your Strategy

Once your reports and tests start generating data, the real work begins. This part is all about asking "why" and turning those answers into strategic adjustments.

Imagine your data shows a landing page has a crazy high bounce rate. The diagnosis phase is about figuring out the cause. Is the page loading too slowly? Is the headline misleading compared to the ad copy? Are there way too many form fields?

Use your analytics to formulate an actionable plan. If you suspect the form is too long, your next action is to run an A/B test with a shorter form. If the test proves your hypothesis and conversions increase by 15%, you’ve successfully turned an insight into a tangible improvement.

This is how you foster a culture of continuous, data-informed progress—closing the loop and turning your marketing measurement into a true engine for business growth.

Your Top Marketing Measurement Questions, Answered

Let's be honest, navigating the world of marketing analytics can feel like trying to drink from a firehose. You’ve got data coming from everywhere. Here are some straightforward answers to the questions I hear most often from marketers trying to connect their work to real results.

How Often Should I Actually Look at My Metrics?

This is a classic. The right answer depends entirely on what you're looking at. Checking your customer lifetime value every morning is a recipe for anxiety, but waiting a month to check on a new ad campaign's CPC is a great way to waste money.

You need to think in tiers. Here’s a simple, actionable schedule that works:

  • Daily or Weekly: This is for the fast-twitch metrics. Think Cost Per Click (CPC), ad impressions, social media comments, and shares. These are the numbers that tell you if a live campaign is healthy or needs immediate attention. You're looking for spikes and dips—anything that needs a quick fix.
  • Monthly: Now you can zoom out a bit. It's time to review channel performance. How is overall organic traffic growing? What's our Cost Per Lead (CPL) looking like for the month? Are email open rates trending up or down? This is where you spot broader trends and decide where to focus your energy for the next 30 days.
  • Quarterly: This is the big picture review. It’s when you report on the metrics that matter to the C-suite: Customer Lifetime Value (CLV), Customer Acquisition Cost (CAC), and total marketing-generated revenue. These high-level numbers inform major strategic decisions and budget allocations.

What's the Best Analytics Stack for a Small Business?

If you're a small business, your goal is to get the most insight for the least amount of complexity and cost. You absolutely do not need some massive, enterprise-level platform that requires a dedicated analyst to run.

Instead, a few key tools, used together, can give you a surprisingly powerful view of what's working.

Here’s a fantastic starting point:

  • Google Analytics (GA4): This is non-negotiable. It’s free, and it's the bedrock for understanding who is coming to your website, how they got there, and what they do once they arrive.
  • Your CRM's Built-in Analytics: Whether you're using HubSpot, Zoho, or something else, your CRM is a goldmine. It's where you can finally connect a specific marketing campaign to an actual closed deal.
  • Native Social Media Analytics: Don't overlook the free tools built right into platforms like LinkedIn and Instagram. They offer incredibly deep insights into your audience, what content resonates, and how people are engaging with your brand.

This simple trio gives you a 360-degree view without breaking the bank. As you grow, you can layer in more specialized tools for things like SEO or heat mapping, but this is the perfect foundation.

How Do I Prove the ROI of My Content Marketing?

This one feels tricky, right? Content marketing's impact often builds slowly and indirectly. A blog post doesn't always lead to an immediate sale like a direct-response ad. The secret is to stop focusing on vanity metrics like page views and start connecting content to tangible business goals.

The biggest mistake I see is when teams judge content on last-touch attribution alone. Someone might read five of your articles over three months before they finally click an ad, but that ad gets 100% of the credit. You need a smarter way to look at it.

Here’s a practical, step-by-step way to calculate content ROI:

  1. Find Your Content-Sourced Leads: Dive into your analytics and identify how many people who first found your site through a piece of content (like a blog post) eventually became a lead (by downloading an ebook, signing up for your newsletter, etc.).
  2. Give Those Leads a Dollar Value: Sit down with your sales team and figure out the average value of a lead. Let's say 10% of leads become customers, and the average customer is worth $5,000 in their first year. Simple math tells you each lead is worth $500 in potential revenue.
  3. Do the ROI Math: If a single blog post cost you $500 to create and it generated 4 leads in six months, it has produced $2,000 in pipeline value. That's a 300% ROI.

This approach ties your content creation costs directly to potential revenue, giving you a powerful, defensible metric that proves your content is more than just words on a page—it's a revenue driver.


Ready to stop guessing and start knowing what drives your marketing success? marketbetter.ai uses predictive analytics to connect every campaign to real business outcomes, helping you optimize spend and prove your impact. See how our AI-powered platform can transform your measurement strategy at https://www.marketbetter.ai.