What Is Multivariate Testing A Practical Guide
Multivariate testing (or MVT for short) is a powerful way to optimize a webpage by testing multiple changes across different elements all at the same time. Instead of running separate tests for each tiny change, you test them in combination to find the exact mix that delivers the best results.
Understanding Multivariate Testing in Plain English

Think of it like tuning a high-performance engine. An A/B test is like swapping out the spark plugs to see if you get more power. It’s a simple, direct comparison: Part A vs. Part B. Good, but limited.
Multivariate testing is like having a full pit crew. You’re not just swapping one part; you’re simultaneously testing different fuel mixtures, tire pressures, and spoiler angles to find the absolute perfect combination for the fastest lap time.
MVT goes way beyond a simple "this vs. that" showdown. Its real magic is in showing you how different elements interact. You might discover your punchy new headline only works when it’s paired with a specific hero image—an insight a standard A/B test would never uncover.
The Core Idea and Historical Roots
While it feels like a modern marketing tactic, the fundamental concept is centuries old. The idea of testing multiple factors at once has been around for ages. One of the earliest examples comes from 1747, when Royal Navy surgeon James Lind tested different combinations of remedies to find a cure for scurvy. You can read more about MVT's history on AB Tasty's blog.
Today, MVT is the go-to tool for refining high-traffic pages without needing a total redesign. By making small, simultaneous tweaks to key elements, you can pinpoint the exact recipe that gets you the biggest wins.
Actionable Tip: Don't use MVT for a total page redesign. Use it to fine-tune an existing, high-performing page by testing the headline, CTA button, and hero image simultaneously to find the most powerful combination.
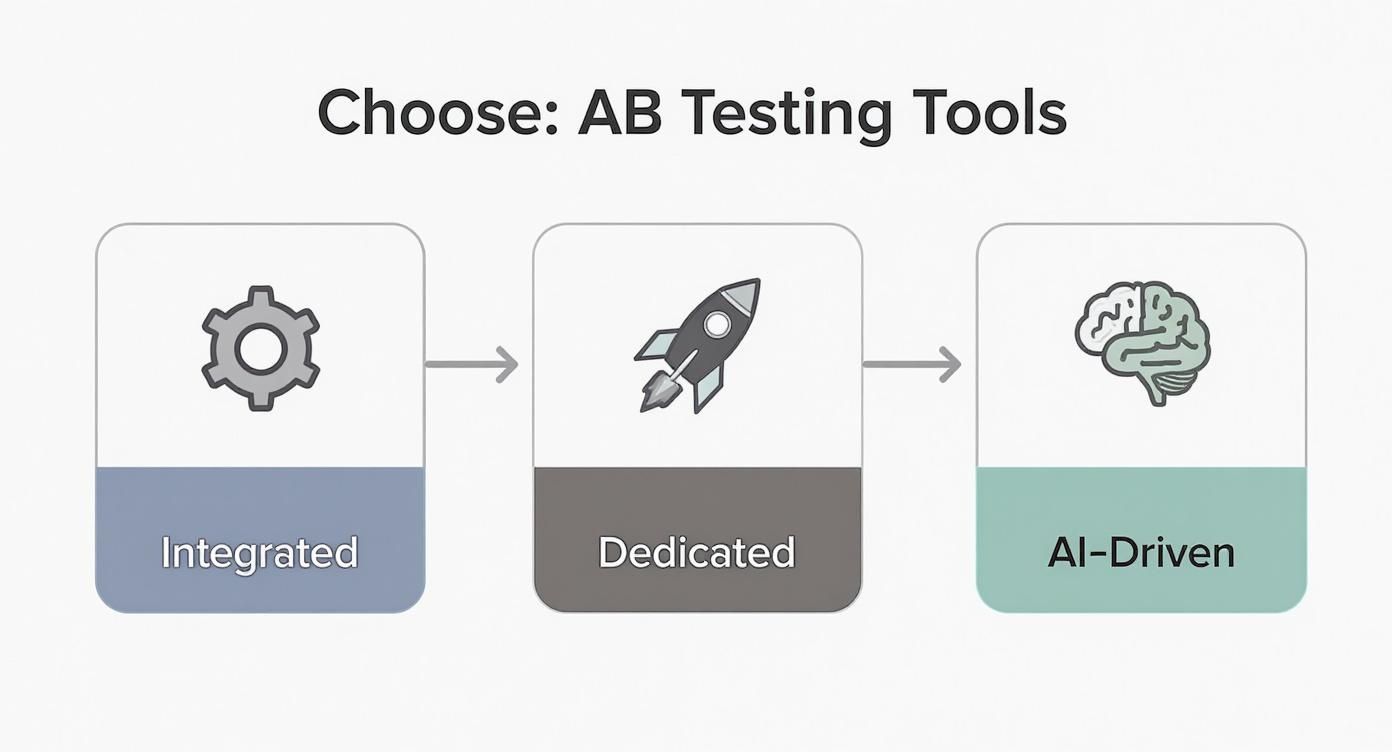
Testing Methods at a Glance
To really get what MVT is all about, it helps to see how it stacks up against other common testing methods. Each one has its place, and knowing when to use which is half the battle.
Here’s a quick rundown to help you choose the right tool for the job.
| Testing Method | What It Tests | Best For | Traffic Needs |
|---|---|---|---|
| A/B Testing | A single element with one or more variations (e.g., Headline A vs. Headline B). | Radical redesigns or testing one big, bold change to see which performs better. | Low to Moderate |
| Multivariate Testing | Multiple elements and their variations simultaneously to find the best combination. | Fine-tuning high-traffic pages by optimizing the interaction between several elements. | High |
| Split URL Testing | Two or more entirely different web pages hosted on separate URLs. | Major overhauls, such as comparing a completely new landing page design against the original. | Low to Moderate |
Ultimately, your goal dictates the test. If you’re making a big, directional change and need a clear winner, A/B testing is your best bet. But if you want to scientifically squeeze every last drop of performance out of an already successful page, multivariate testing is the only way to go.
So, Which Test Should You Run? A/B or Multivariate?
Deciding between an A/B test and a multivariate test isn't just a technical detail—it's a strategic call. The right move depends entirely on what you're trying to achieve. Are you swinging for the fences with a bold new design, hoping for a massive win? Or are you meticulously polishing an already solid page, trying to squeeze out every last drop of performance?
Getting this choice right is the foundation of any good testing program.
Think of it this way: A/B testing is a duel. You pit your champion (the original page) against a single challenger (the new version) to see who comes out on top. It’s fast, the winner is obvious, and it's perfect for testing big, radical ideas.
Multivariate testing, on the other hand, is a team tournament. You're not just finding the best player; you're figuring out the dream team lineup. It analyzes how every player (headline, image, CTA) performs with every other teammate to find the single most powerful combination. It’s a slower, more data-hungry process, but the insights are incredibly deep.
When to Use A/B Testing: Go for Big Swings and Clear Answers
A/B testing really shines when you're testing significant, high-impact changes. It’s the tool you pull out when your hypothesis boils down to a single, pivotal question.
You should absolutely opt for an A/B test for things like:
- Complete Redesigns: You’ve built a brand-new landing page from scratch and want to know if it crushes the old one.
- Validating a New Offer: You're testing a fundamental shift in your value proposition or core messaging.
- Major User Flow Changes: You want to pit two completely different checkout processes or signup funnels against each other.
Because A/B tests are just comparing a couple of distinct versions, they don't need a ton of traffic to get a clear, statistically significant result. That means you get answers fast. If you're new to this, it's worth understanding how to conduct A/B testing before diving into more complex experiments.
When to Use Multivariate Testing: For Incremental Gains and Deep Insights
Multivariate testing (MVT) is your go-to for optimization, not revolution. You use it on pages that are already performing pretty well but you know have more potential. MVT is all about fine-tuning the experience by finding the perfect recipe of smaller elements.
Consider firing up a multivariate test when you want to:
- Refine a High-Traffic Page: Like your homepage, where you want to test the headline, hero image, and CTA button text all at once.
- Improve a Key Landing Page: Testing different form field labels, button colors, and social proof elements to nudge lead generation higher.
- Optimize Product Pages: Experimenting with product descriptions, image styles, and trust badges to get more people hitting "add to cart."
The real magic of MVT is its ability to uncover interaction effects—how changing your headline might suddenly make a different CTA button more effective. This is an insight A/B testing simply can’t give you, helping you build a much deeper, almost intuitive, understanding of what your audience really wants.
A/B Testing vs Multivariate Testing: Choosing Your Approach
To make this crystal clear, let's break down the strategic differences. Choosing the right method is about matching the tool to your goals, traffic, and the specific questions you need answered. Getting it wrong just leads to muddy results and wasted clicks.
This table should help you decide which approach fits your immediate needs.
| Attribute | A/B Testing | Multivariate Testing (MVT) |
|---|---|---|
| Primary Goal | Find a clear "winner" between two or more completely different versions. | Identify the best combination of elements and see how they influence each other. |
| Best Use Case | Radical redesigns, testing a single big change, validating a bold new concept. | Fine-tuning high-performing pages by testing multiple small changes simultaneously. |
| Complexity | Low. Simple to set up and the results are easy to read. | High. Requires more careful planning, a more complex setup, and deeper analysis. |
| Traffic Needs | Low to moderate. You can get a statistically significant winner with less traffic. | High. You need a lot of traffic to properly test every possible combination. |
| Speed to Results | Fast. You can often get a clear answer in a much shorter timeframe. | Slow. Tests have to run longer to gather enough data across all the variations. |
Ultimately, A/B and multivariate tests aren't rivals. They're complementary tools in your optimization arsenal.
Think of it this way: Use A/B testing to find the right forest. Then, use multivariate testing to find the perfect path through it.
How to Design a Powerful Multivariate Test
Alright, let's get our hands dirty. Moving from knowing what a multivariate test is to actually building one is where the real work begins. Designing a powerful test isn't about throwing spaghetti at the wall to see what sticks; it’s a disciplined process that starts way before you hit "launch."
The whole thing lives or dies by one single element: your hypothesis. A weak, fuzzy hypothesis gives you muddy, useless results. A sharp one is your North Star, guiding every single decision from here on out.
Start with a Strong, Measurable Hypothesis
Before you touch a single pixel on the page, you have to be crystal clear about what you think will happen and, more importantly, why. A real hypothesis isn't a vague question like, "Will a new headline work better?" That's not a plan; that's a wish.
Instead, your hypothesis needs to be a predictive statement connecting a specific change to a measurable outcome. It needs teeth.
Actionable Example: "By changing the CTA button text from 'Sign Up' to 'Get Started Free' and replacing the stock hero image with a customer testimonial video, we will increase trial sign-ups by 15% because the new combination will build more trust and create a lower-commitment entry point."
See the difference? It's specific. It's measurable (a 15% lift). And it gives you the "why." This structure forces you to think through the user psychology you're trying to influence. Even if the test fails to lift conversions, you still learn something valuable about your audience's motivations.
This visual gives you a simple gut-check on which testing path makes the most sense.
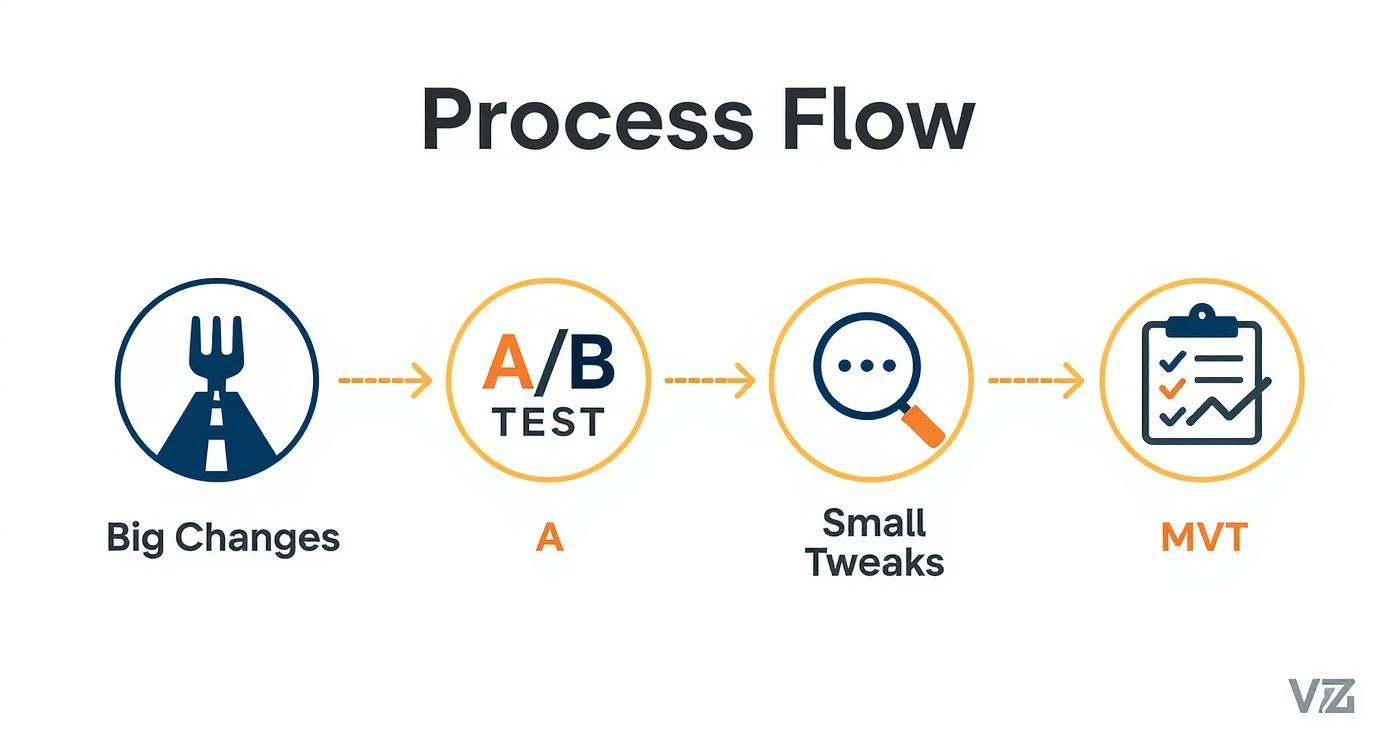
As you can see, if you're making a big, bold change to a page, an A/B test is your best friend. But when you’re ready to fine-tune the winning formula by testing smaller, interacting elements, MVT is the tool for the job.
Select High-Impact Variables and Variations
Hypothesis locked in? Good. Now you need to pick which page elements—the variables—you're actually going to test. The trick here is to resist the temptation to test everything. Focus your firepower on the components that are most likely to move the needle on your primary goal.
Common variables with real leverage include:
- Headline and Subheadings: This is your value proposition in a nutshell. Get it wrong, and nothing else matters.
- Hero Image or Video: It’s the first thing people see. It sets the emotional tone instantly.
- Call-to-Action (CTA) Button: The words, the color, the placement—it can all dramatically change click-through rates.
- Social Proof Elements: Things like testimonials, customer logos, or review scores are all about building trust and credibility.
For each variable you pick, you'll create different versions, or variations. For your headline, maybe you test a benefit-focused variation against a question-based one. For a CTA button, it could be "Get Started" vs. "Request a Demo." You're looking for meaningful differences that truly test your assumptions.
This is also a great place to bring in what you know about your audience. By understanding customer segmentation strategies, you can craft variations designed to resonate with the specific needs or mindsets of different user groups.
Understand Traffic and Time Commitments
Finally, a reality check. MVT is a powerful tool, but it's a hungry one. Because it has to test every single combination of your variations, it chews through a lot of traffic to get a clean result.
Think about it: a test with two variables that each have two variations creates four unique combinations. Now add a third variable with two variations of its own, and you've suddenly jumped to eight combinations. The math gets big, fast.
Before you go live, use a sample size calculator. Get a realistic estimate of the traffic you'll need and how long the test will have to run to reach statistical significance. If your page isn't getting thousands of conversions a month, MVT might not be the right move. A series of clean, focused A/B tests would likely serve you better. Setting these expectations upfront keeps you from pulling the plug too early and making bad decisions on shaky data.
Running and Analyzing Your Test for Actionable Insights
Launching your multivariate test is a great feeling, but it’s just the starting line. The real money is made in what comes next: carefully watching the experiment unfold and, more importantly, making sense of the data it spits out. This is where you turn raw numbers into powerful, lasting lessons about what actually gets your audience to act.
Success here isn’t about finding one “perfect” combination and calling it a day. It’s about understanding the specific influence of each headline, button, and image you tested. That’s the kind of granular insight that pays dividends across all your marketing, turning a single test into a wellspring of strategic intelligence.
Monitoring Your Campaign and Key Metrics
Once your test is live, the first rule is to have some patience. It’s so tempting to check the results every five minutes, but early data is a notorious liar. One variation might shoot out to an early lead purely by chance, only to fizzle out as more traffic comes in. You have to let the test run long enough to get a reliable signal from the noise.
And don't just stare at your main conversion goal, like sales or sign-ups. You need to track secondary metrics to get the full story of what users are really doing. These often reveal subtle but critical interaction effects.
- Bounce Rate: Did that killer new headline grab attention but fail to deliver, causing people to hit the back button immediately?
- Time on Page: Are users sticking around longer with a certain image and description pairing, even if they aren't converting right away? That's a sign of engagement.
- Click-Through Rate on Secondary CTAs: Is one version of your main button so effective that it’s stealing clicks from other important links on the page?
Tracking these data points helps you build a much richer story. It’s the difference between knowing what worked and truly understanding why it worked.
Demystifying Statistical Significance
As the numbers roll in, you’re looking for one thing above all else: statistical significance. Put simply, this is a measure of confidence. When a result is statistically significant—usually at a 95% confidence level or higher—it means you can be pretty sure the outcome wasn't just a random fluke.
Think of it like a clinical trial. You wouldn't trust a new drug if only three out of five patients got better. You'd want to see consistent results across a huge group to be confident it actually works. Statistical significance is the mathematical proof for your marketing experiments.
Getting to that level of confidence takes time and traffic. In fact, many analytics providers find that to run a successful MVT campaign, you often need at least 10,000 visitors a month, with tests running for several weeks. It requires patience, but the payoff can be a 20-30% lift in conversions—far beyond what simpler tests typically achieve. You can dig into more multivariate testing benchmarks at AB Tasty.
Interpreting Data and Finding Actionable Insights
Once your test hits statistical significance, it’s analysis time. Your testing tool will show you which combinations won, but the real gold is in isolating the impact of individual elements. You might discover that one headline consistently crushed it, no matter which image it was paired with. That’s a huge win! It’s a portable insight you can now apply to other landing pages, email subject lines, and ad copy.
This is also where more advanced tools can help you spot patterns that aren't immediately obvious. Using predictive analytics in marketing, for instance, can help forecast the long-term impact of a winning combination across different customer segments.
Ultimately, the goal is to find concrete actions on how to improve website conversion rates across the board. Don't just anoint the winner and move on. Force yourself to answer these questions:
- What did we learn about our customers? Did they respond better to emotional language or to hard data?
- Which single element had the biggest impact? This tells you exactly where to focus your optimization efforts next.
- Were there any results that completely surprised us? Often, the tests that demolish our assumptions are the most valuable ones.
By asking these questions, you build a powerful feedback loop. Every test—whether it’s a runaway success or a total flop—becomes a valuable step toward mastering your marketing.
Real-World Examples of MVT Driving Growth

This is where the rubber meets the road. All the theory in the world doesn't mean much until you see how companies are actually using MVT to make smarter decisions and, frankly, make more money.
Multivariate testing isn't some abstract academic exercise. It’s a battle-tested tool that top teams use to uncover surprising truths about their customers. Let's look at a few examples of MVT in the wild.
How a SaaS Company Fixed Its Pricing Page
A B2B SaaS company had a classic "good problem" that was driving them crazy. Their pricing page was pulling in solid traffic, but the demo request form at the end felt like a brick wall. Conversions were totally flat.
Instead of throwing the whole page out and starting over—a classic A/B test move—they decided to get surgical with an MVT approach. They had a hunch that the problem wasn't one big thing, but a few small things working against each other.
Here’s what they decided to test simultaneously:
- Variable 1 (The Plan Names):
- Variation A: Standard stuff like "Basic," "Pro," and "Enterprise."
- Variation B: More aspirational names like "Starter," "Growth," and "Scale."
- Variable 2 (The Feature Bullets):
- Variation A: A dry list of technical features.
- Variation B: Benefit-focused bullets (e.g., "Save 10 hours per week").
- Variable 3 (The CTA Button):
- Variation A: The old standby, "Request a Demo."
- Variation B: A lower-pressure option, "See it in Action."
The winning combo was a genuine surprise. "Growth" as the plan name, paired with the benefit-focused feature list and the "See it in Action" CTA, delivered a 22% lift in qualified demo requests.
The real gold was in the why. The "Growth" plan name subconsciously primed visitors to think about outcomes, which made the benefit-oriented descriptions hit that much harder. It was a masterclass in how aligning every little element around a single psychological message can create a huge impact.
Cracking the "Add to Cart" Code for an E-commerce Brand
An online apparel store was struggling with a key funnel metric: the add-to-cart rate. Shoppers were looking, but they weren't committing. The team suspected a combination of weak visuals, unclear urgency, and shipping anxiety was causing the hesitation. MVT was the perfect tool to untangle it all.
Their hypothesis was that showing the product in a real-world context, making the discount obvious, and removing shipping cost fears would be the one-two-three punch they needed.
They set up a test with these moving parts:
- Variable 1 (Product Photos):
- Variation A: Clean, product-on-white-background shots.
- Variation B: Lifestyle photos showing models wearing the apparel.
- Variable 2 (The Discount):
- Variation A: Simple "25% Off" text.
- Variation B: A "slash-through" price showing both the original and sale price.
- Variable 3 (Shipping Info):
- Variation A: Tucked away in fine print below the button.
- Variation B: A big, can't-miss-it banner: "Free Shipping On Orders Over $50."
The results were immediate and massive. The combination of lifestyle photos, the slash-through price, and the prominent shipping banner boosted add-to-cart actions by a whopping 31%.
This is the kind of insight that goes way beyond a single page. These findings can inform all sorts of marketing personalization strategies, because now they know exactly which visual and value cues their audience responds to.
The big takeaway? While each change had a small positive effect on its own, their combined power was explosive. The lifestyle shots created desire, the price comparison proved the value, and the shipping banner erased the last bit of friction. It was a perfect storm of persuasion, discovered only through MVT.
Common MVT Mistakes and How to Avoid Them
Even the sharpest marketers can see a multivariate test go completely sideways. You end up with junk data that points you in the wrong direction, and that's worse than having no data at all. Think of this as your pre-flight checklist—the stuff you absolutely have to get right before launching.
The single most common mistake? Testing too many elements with too little traffic. It’s tempting, I get it. You want to test five headlines, four images, and three CTAs all at once. But that creates a ridiculous number of combinations, and your traffic gets spread so thin that no single version can prove its worth in a reasonable timeframe. You'll be waiting forever for a statistically significant result.
The fix is to be ruthless. Prioritize. Focus on just 2-3 high-impact elements at a time. This keeps the number of combinations under control and gives each one a fighting chance to get enough data to be reliable.
Letting Impatience Drive Decisions
Here's another classic blunder: calling a test too early. You see one combination shoot out to an early lead after a couple of days and the urge to declare a winner is almost overwhelming. Don't do it. Early results are often just statistical noise, not a true reflection of user preference.
You absolutely have to let the test run its course until you hit a statistical significance level of at least 95%. Just as important, let it run for a full business cycle—at least one full week, ideally two. This smooths out the weird fluctuations you see between weekday and weekend user behavior.
A test stopped prematurely is worse than no test at all. It gives you false confidence in a conclusion that is likely based on random chance, not genuine user insight.
The Right Way vs. The Wrong Way
Let's make this concrete. Seeing the difference between a sloppy test and a disciplined one is the key to getting answers you can actually trust.
| The Common Mistake | The Actionable Solution |
|---|---|
| Spreading Traffic Too Thin: Testing 5 variables with 3 variations each (243 combinations). | Focusing on Impact: Testing 3 high-impact variables with 2 variations each (8 combinations). |
| "Peeking" and Ending Early: Stopping the test after 3 days because one variation is ahead by 10%. | Exercising Patience: Running the test for 2 full weeks until it reaches a 95% confidence level. |
| Ignoring External Factors: Not considering a concurrent social media campaign driving unusual traffic. | Maintaining a Clean Environment: Pausing other major campaigns or segmenting traffic to isolate the test's impact. |
Finally, a critical error people overlook is failing to account for outside noise. Did a massive email blast or a viral social post go live in the middle of your test? Events like that can flood your page with a totally different kind of visitor, polluting your data and making the results meaningless.
The best practice here is to create a controlled environment. If you can, avoid launching other big marketing initiatives that might contaminate your test traffic. If that's not possible, you'll need to use advanced segmentation to isolate and exclude that traffic from your results. This discipline is what makes sure the insights you get from understanding what is multivariate testing are clean, reliable, and genuinely actionable.
Try our Marketing Plan Generator — generate a complete AI-powered marketing plan in minutes. No signup required.
Your Multivariate Testing Questions, Answered
Alright, you've got the theory down. But when the rubber meets the road, real-world questions always pop up. Let's tackle the most common ones marketers ask right before they hit "launch."
Seriously, How Much Traffic Do I Need?
There’s no magic number, but the honest answer is: a lot more than you'd need for a simple A/B test. The traffic requirement is tied directly to your current conversion rate and, crucially, the number of combinations you’re testing.
Every new element you add to the mix multiplies the number of variations, slicing your audience into smaller and smaller groups. Each one needs enough data to be statistically sound.
Actionable Takeaway: Pages that see thousands of conversions per month are prime candidates for MVT. If your page gets less traffic, stick to a series of focused A/B tests. You'll get clearer answers much faster without spreading your traffic too thin.
Before you even think about building the test, plug your numbers into a sample size calculator. It's the best way to avoid running a test that was doomed from the start.
How Long Should a Test Run?
Patience is key here. Your test needs to run long enough to hit statistical significance (the industry standard is a 95% confidence level) and to cover a full business cycle. A bare minimum is one to two full weeks.
Why? Because this duration smooths out the weird dips and spikes you see on weekends versus weekdays. It also accounts for traffic from a weekly newsletter or a short-lived promotion that could throw off your results. Never, ever stop a test early just because one version is rocketing ahead. Early leads are often just random noise.
Can I Test More Than Three or Four Elements at Once?
You can, but it's rarely a good idea. Modern tools can handle the complexity, but your traffic probably can't. Every element you add exponentially increases the number of combinations, spreading your traffic dangerously thin.
Just look at the math:
- 3 Elements, 2 Variations Each: 2 x 2 x 2 = 8 combinations
- 4 Elements, 2 Variations Each: 2 x 2 x 2 x 2 = 16 combinations
- 5 Elements, 2 Variations Each: 2 x 2 x 2 x 2 x 2 = 32 combinations
For most businesses, the sweet spot is testing 2-4 high-impact elements. This gives you rich, actionable data on how your most important page components work together, without demanding an impossible amount of traffic to get a reliable answer.
Ready to stop guessing and start winning? The marketbetter.ai platform uses AI to automate this entire process, analyzing countless combinations to find the precise formula that drives real growth. See how our AI-powered marketing platform can transform your campaigns at https://www.marketbetter.ai.