How to Build an AI Customer Health Scoring System with OpenClaw [2026]
Your CRM says the account is "active." Your CSM says the relationship is "strong." Then the customer churns — and everyone acts surprised.
The problem isn't that churn signals don't exist. They do. Login frequency dropping. Support tickets spiking. Feature adoption plateauing. The problem is that no human can monitor 200 accounts across 15 different signals in real time.
That's exactly the kind of work AI coding agents like OpenClaw and Claude Code were built for.
In this guide, we'll walk through how to build an automated customer health scoring system that monitors real-time signals, calculates composite health scores, and triggers proactive retention workflows — all without writing a single line of traditional application code.
Why Traditional Customer Health Scores Fail
Most customer success teams calculate health scores quarterly — maybe monthly if they're disciplined. Here's why that's broken:
The data is always stale. By the time your CSM reviews a quarterly business report, the customer has already been disengaging for weeks. A 30-day delay in detecting churn signals is 30 days of preventable revenue loss.
Manual scoring doesn't scale. When you have 50 accounts, a spreadsheet works. At 200+ accounts, your CSMs are spending more time updating scores than actually saving accounts.
Single-signal blindness. Most teams track NPS or product usage, but not both together with support sentiment, billing patterns, and engagement velocity. Churn is almost always multi-signal.
No automated response. Even when a health score drops, the "workflow" is usually "CSM notices it in a weekly meeting and promises to reach out." By then, the customer is already evaluating competitors.
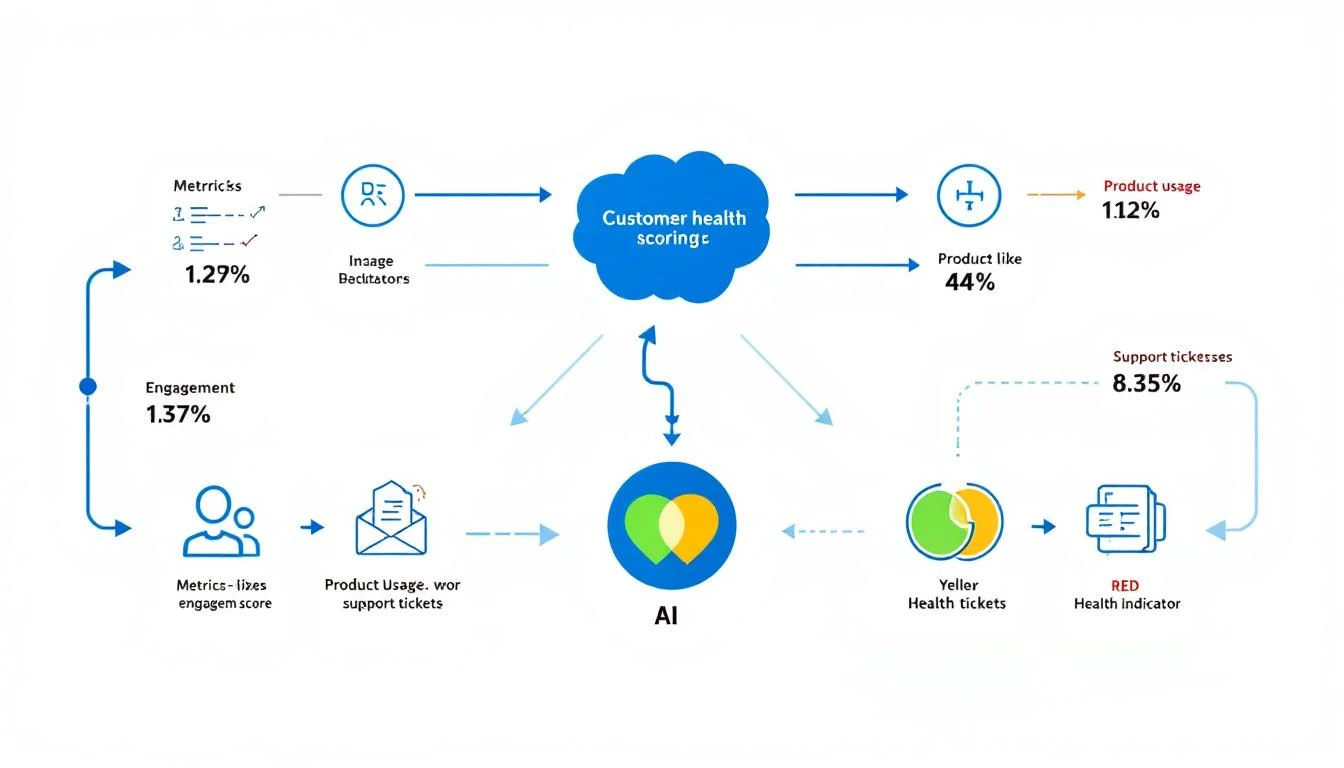
The AI-Powered Alternative
Here's what an AI-driven health scoring system looks like:
- Continuous monitoring — Every hour, your AI agent pulls fresh data from your CRM, product analytics, support platform, and billing system
- Multi-signal scoring — Claude Code analyzes 10+ signals simultaneously, weighting each based on historical correlation with churn
- Trend detection — Instead of just current score, the system tracks velocity — is the score improving, stable, or deteriorating?
- Automated intervention — When a score drops below threshold, the system triggers the right playbook: CSM alert, executive outreach, or product team escalation
The Signals That Actually Predict Churn
Before we build anything, let's define what to track. Based on analysis of B2B SaaS churn patterns, these are the signals that matter most:
High-Weight Signals (Direct Churn Predictors)
- Product login frequency — Declining logins over 14-day rolling window
- Feature adoption depth — Number of core features used vs. available
- Support ticket sentiment — Are tickets getting more frustrated?
- Contract renewal date proximity — Accounts within 90 days of renewal need extra attention
- Champion departure — Your internal champion leaving the company
Medium-Weight Signals (Leading Indicators)
- Time-to-resolution trend — Are their support issues taking longer to resolve?
- Meeting engagement — Are they attending QBRs? Responding to check-ins?
- Billing payment patterns — Late payments or disputes
- Product usage breadth — How many team members are active?
Low-Weight Signals (Context Enrichment)
- Company news — Layoffs, restructuring, leadership changes
- Competitor activity — Are they engaging with competitor content?
- NPS/CSAT scores — Useful but lagging indicators
Building the System with OpenClaw + Claude Code
Step 1: Set Up Your OpenClaw Agent
OpenClaw runs as a gateway that connects AI models to your existing tools. Unlike enterprise customer success platforms that cost $30-50K/year, OpenClaw is free and self-hosted.
Your agent needs access to:
- CRM API (HubSpot, Salesforce) — for account and contact data
- Product analytics (Mixpanel, Amplitude, or your own database) — for usage data
- Support platform (Zendesk, Intercom) — for ticket data
- Billing system (Stripe, Chargebee) — for payment patterns
Step 2: Define Your Scoring Model
Here's where Claude Code shines. Instead of hardcoding scoring rules, you describe the logic in natural language and let Claude generate the scoring algorithm:
Score each account on a 0-100 scale using these weighted factors:

- Login frequency (last 14 days vs. previous 14): 25% weight
- Feature adoption (features used / total available): 20% weight
- Support ticket sentiment (positive/neutral/negative): 15% weight
- Days until renewal: 15% weight
- Team member activity (active users / total seats): 10% weight
- Meeting attendance (last 3 scheduled meetings): 10% weight
- Payment status: 5% weight

Apply these rules:
- If champion contact has changed companies → subtract 20 points
- If no login in 7+ days → cap score at 40
- If support sentiment is "negative" for 3+ consecutive tickets → subtract 15 points
The beauty of using Claude Code: when you want to adjust the model, you just update the natural language description. No code changes, no deployment, no sprint planning.
Step 3: Automate Data Collection with Cron Jobs
OpenClaw's built-in cron system runs your health scoring agent on a schedule. Set it to run every 2 hours during business hours:
The agent pulls fresh data from each source, calculates the composite score, and stores the result. If any account drops below your threshold, it immediately triggers the intervention workflow.
Step 4: Build Intervention Playbooks
This is where the system pays for itself. Instead of just flagging at-risk accounts, your AI agent takes action:
Score 70-85 (Yellow — Watch):
- Log the score change in your CRM
- Add to CSM's weekly priority list
- Draft a personalized check-in email
Score 50-70 (Orange — Intervene):
- Alert CSM via Slack immediately
- Auto-draft a personalized outreach with specific talking points based on the signals driving the score drop
- Schedule a "value review" meeting proposal
Score Below 50 (Red — Escalate):
- Alert CSM + their manager + VP of CS
- Generate an executive summary of the account risk
- Draft an executive-to-executive outreach
- Create a retention plan with specific actions
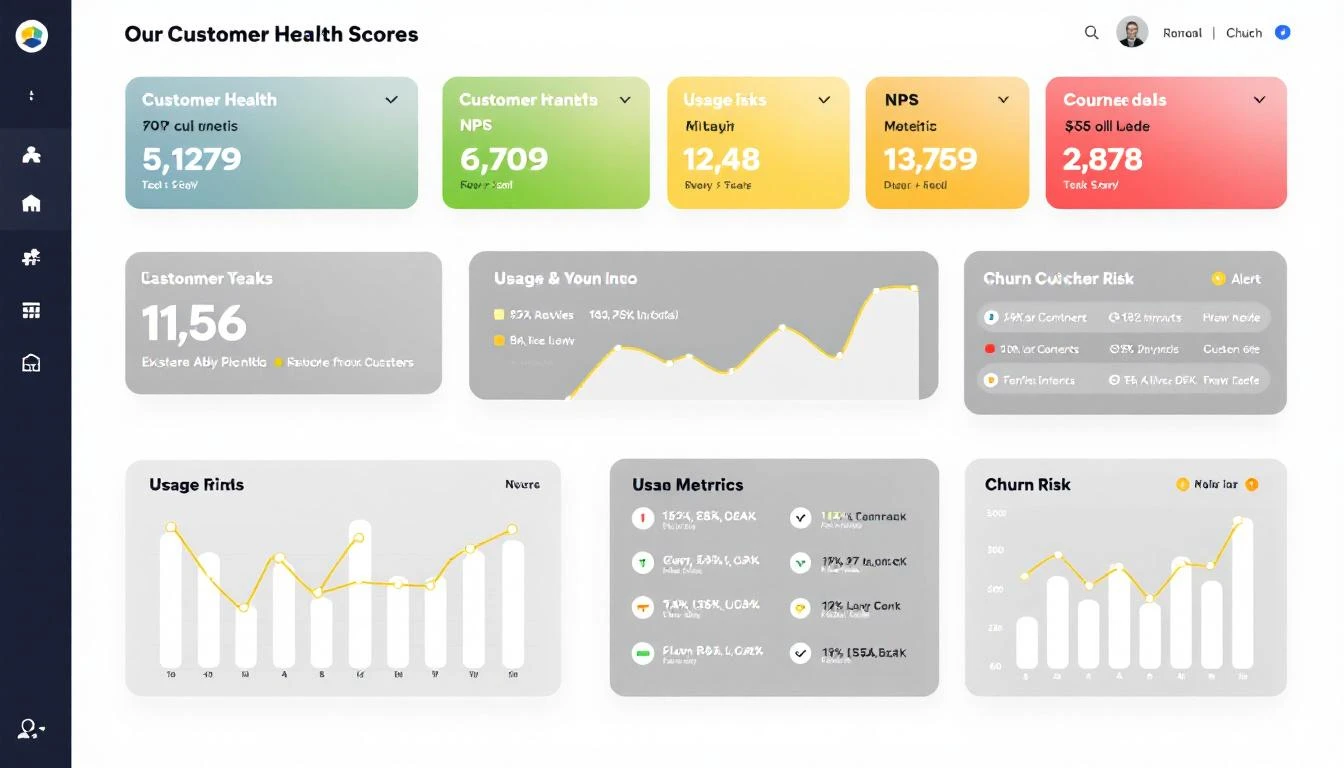
Real-World Impact: The Numbers
Here's what teams typically see after implementing AI-powered health scoring:
| Metric | Before AI | After AI | Change |
|---|---|---|---|
| Churn detection lead time | 2-4 weeks | 2-3 days | 85% faster |
| Accounts per CSM | 50-80 | 150-200 | 2.5x more capacity |
| Gross revenue retention | 85-90% | 93-97% | 5-8 points improvement |
| Time spent on scoring | 4-6 hrs/week | 0 hrs/week | Fully automated |
| False positive rate | 40-50% | 15-20% | 60% reduction |
The ROI math is straightforward: if you have $2M in ARR and improve retention by 5 points, that's $100K in saved revenue — from a system that costs essentially nothing to run.
OpenClaw vs. Enterprise Customer Success Platforms
Let's compare this approach to traditional CS platforms:
| Capability | OpenClaw + Claude | Gainsight/Totango/ChurnZero |
|---|---|---|
| Cost | Free (self-hosted) | $30-80K/year |
| Setup time | Hours | Weeks to months |
| Customization | Unlimited (plain English rules) | Limited to platform features |
| AI quality | Claude's 200K context window | Proprietary models |
| Integration depth | Any API | Pre-built connectors only |
| Scoring logic changes | Update a prompt | Submit a feature request |
| Multi-signal analysis | Native (AI reasoning) | Rule-based scoring |
The enterprise platforms aren't bad — they're just expensive and rigid. OpenClaw gives you the same capabilities with 10x more flexibility at 1/100th the cost.
Advanced: Predictive Churn Modeling
Once your basic scoring system is running, Claude Code can help you level up with predictive modeling:
Pattern Recognition: Feed Claude your historical churn data — accounts that churned vs. renewed — and ask it to identify the signal patterns that preceded churn. This creates a dynamic model that improves over time.
Cohort Analysis: Group accounts by industry, company size, or use case. Different segments churn for different reasons. Your scoring model should reflect that.
Leading Indicator Discovery: Sometimes the strongest churn predictor is something you weren't tracking. Claude can analyze unstructured data — email threads, meeting notes, support conversations — to surface hidden signals.
Getting Started Today
You don't need to build the full system on day one. Start with this 3-step approach:
-
Week 1: Set up OpenClaw with your CRM integration. Build a basic health score using just 3 signals: login frequency, support tickets, and renewal date.
-
Week 2: Add automated Slack alerts for score drops. Get your CSMs comfortable with the system.
-
Week 3: Expand to the full signal set. Build intervention playbooks. Measure the first 30-day impact.
The hardest part isn't building it — it's getting your team to trust the AI's judgment. Start small, prove accuracy, then expand.
Try our Lookalike Company Finder — find companies similar to your best customers in seconds. No signup required.
How MarketBetter Helps
MarketBetter's Daily SDR Playbook already monitors buyer signals and tells your team exactly what to do next. The same philosophy applies to customer success: don't just show data — prescribe action.
Our platform identifies which accounts need attention, prioritizes them by revenue impact, and generates personalized outreach — so your team spends time saving accounts instead of analyzing spreadsheets.
Ready to see how AI-powered customer intelligence works? Book a demo and we'll show you how MarketBetter turns signals into action — for both prospecting and retention.
Related reading: